
Realtime Ai for your control system. The Digital Building Platform brings the power of computer science and cloud computing to your building management system, seamlessly integrating with Tridium’s Niagara Framework. Bring the power of Ai to your Smart Building today.
The main dashboard provides a quick overall view of your building portfolio. You can immediately see the number of active alarms, integrity issues and stability of the data connection. Each tile also provides quick access to the main menu options.
.png)
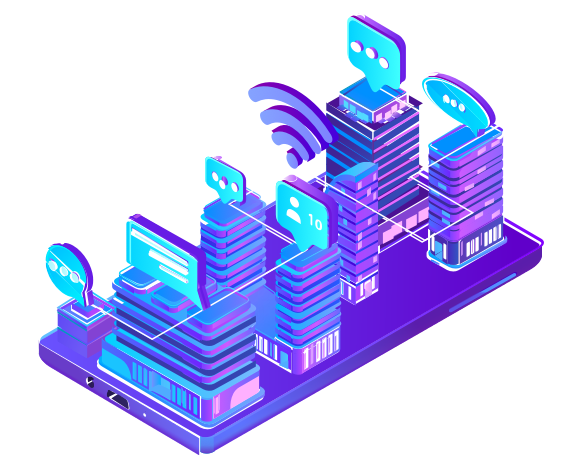
Any data point that is flagged as a meter point will automatically generate automated reports. These reports are downloadable as PDF’s and come as standard with the platform. Within these reports you get the following:
This chart shows the maximum, minimum and average consumption for each day of the month.
A daily chart showing the consumption as a bar chart with a breakdown between working and non-working hours.
A pie chart showing the working vs non-working hours total consumption for the month. A bar chart is also provided. This chart can be significant due to the typically larger number of non-working hours over the number of working hours in a day and week. A higher hourly average during non-working hours would typically indicate poor system operation.
A full profile of each day's consumption is provided with minimums, maximums and average for the day.
This chart is interactive and not included in the downloadable pdf. Selecting any bar will provide a zoomed daily half-hour consumption view for that day also in bar chart format.
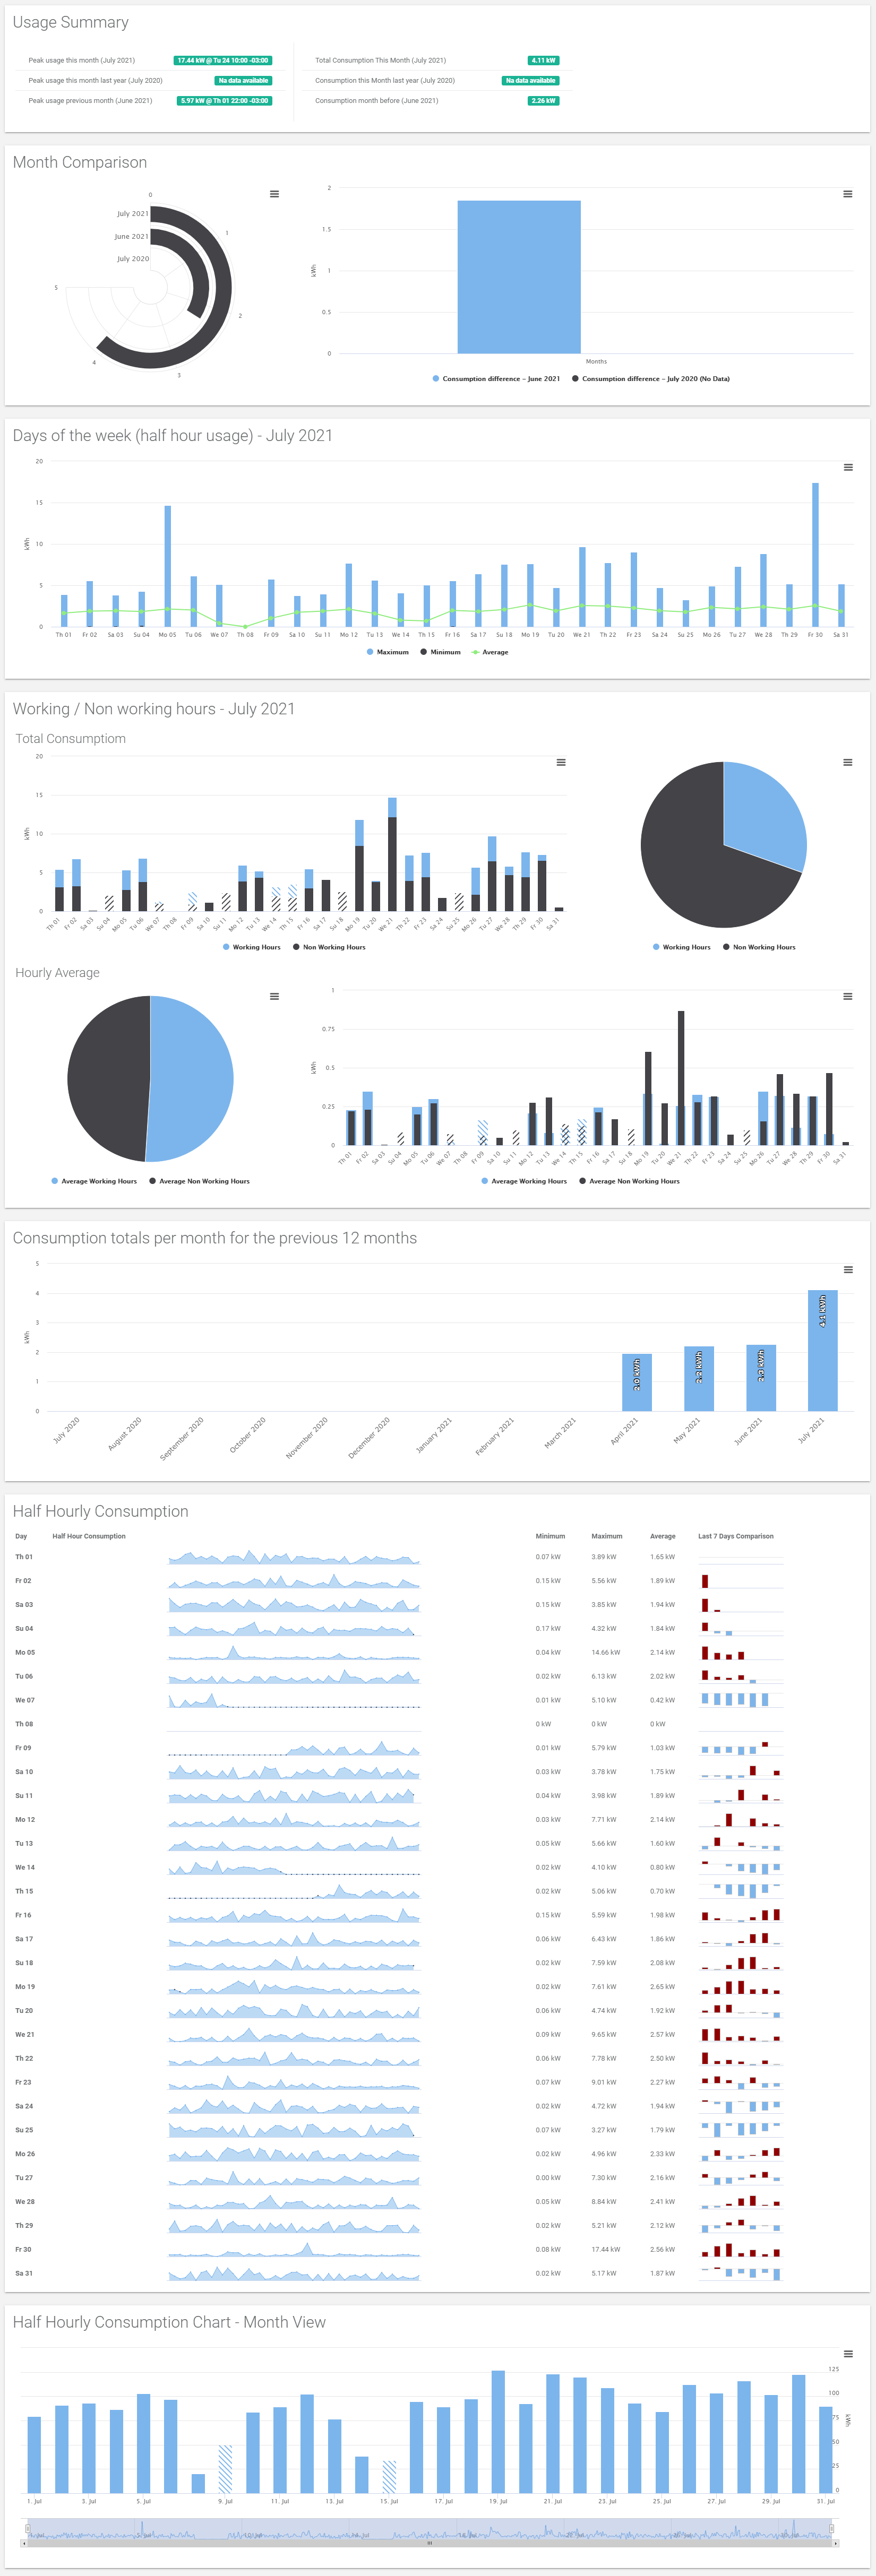
The Digital Building Platform integrates with the Niagara Alarm system to allow you to manage all your alarms from a webpage or mobile app (Android and iOS).
You can view all alarms of each category:
In each case, you have access to each alarm's history and notes with the ability to submit notes with each action.
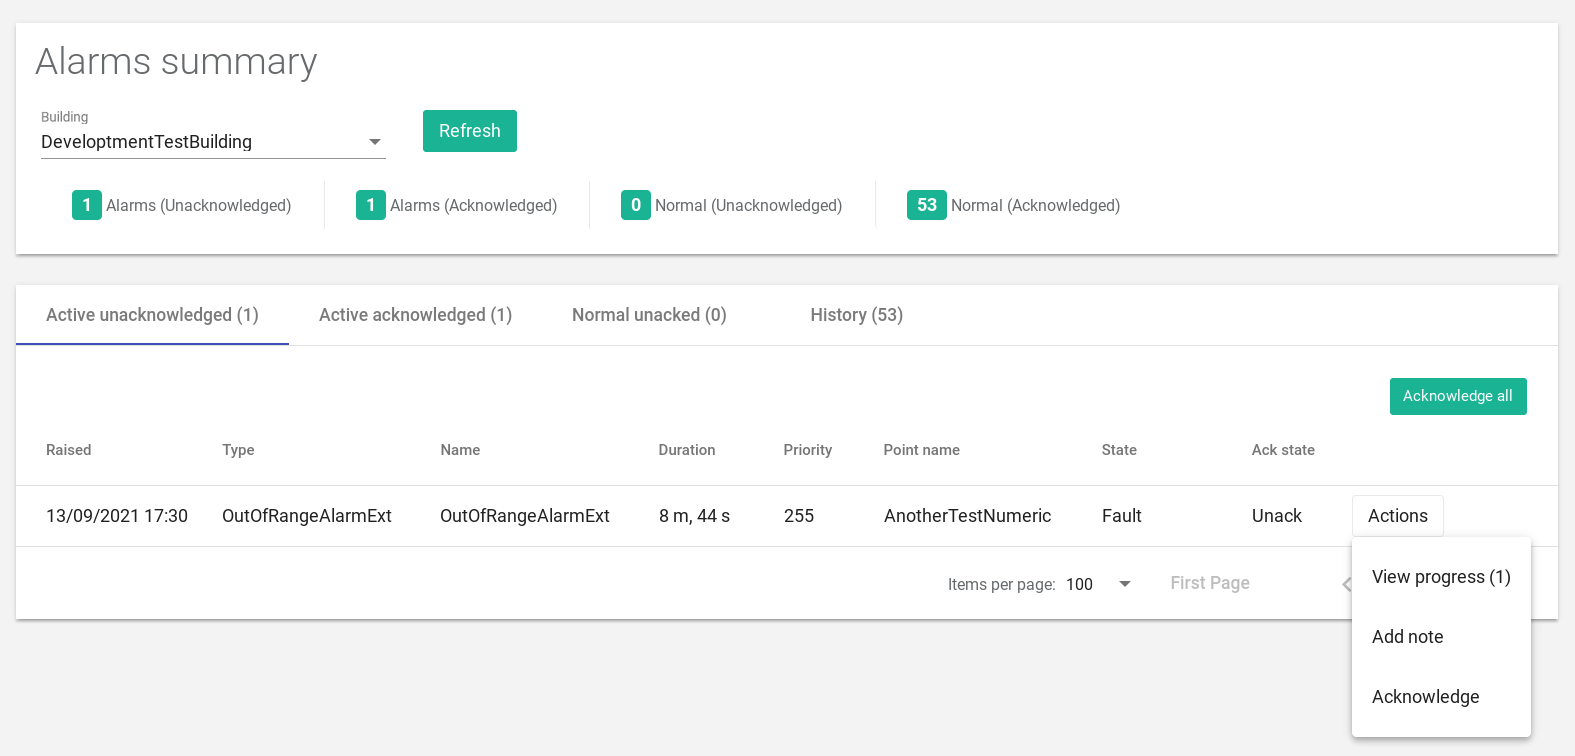
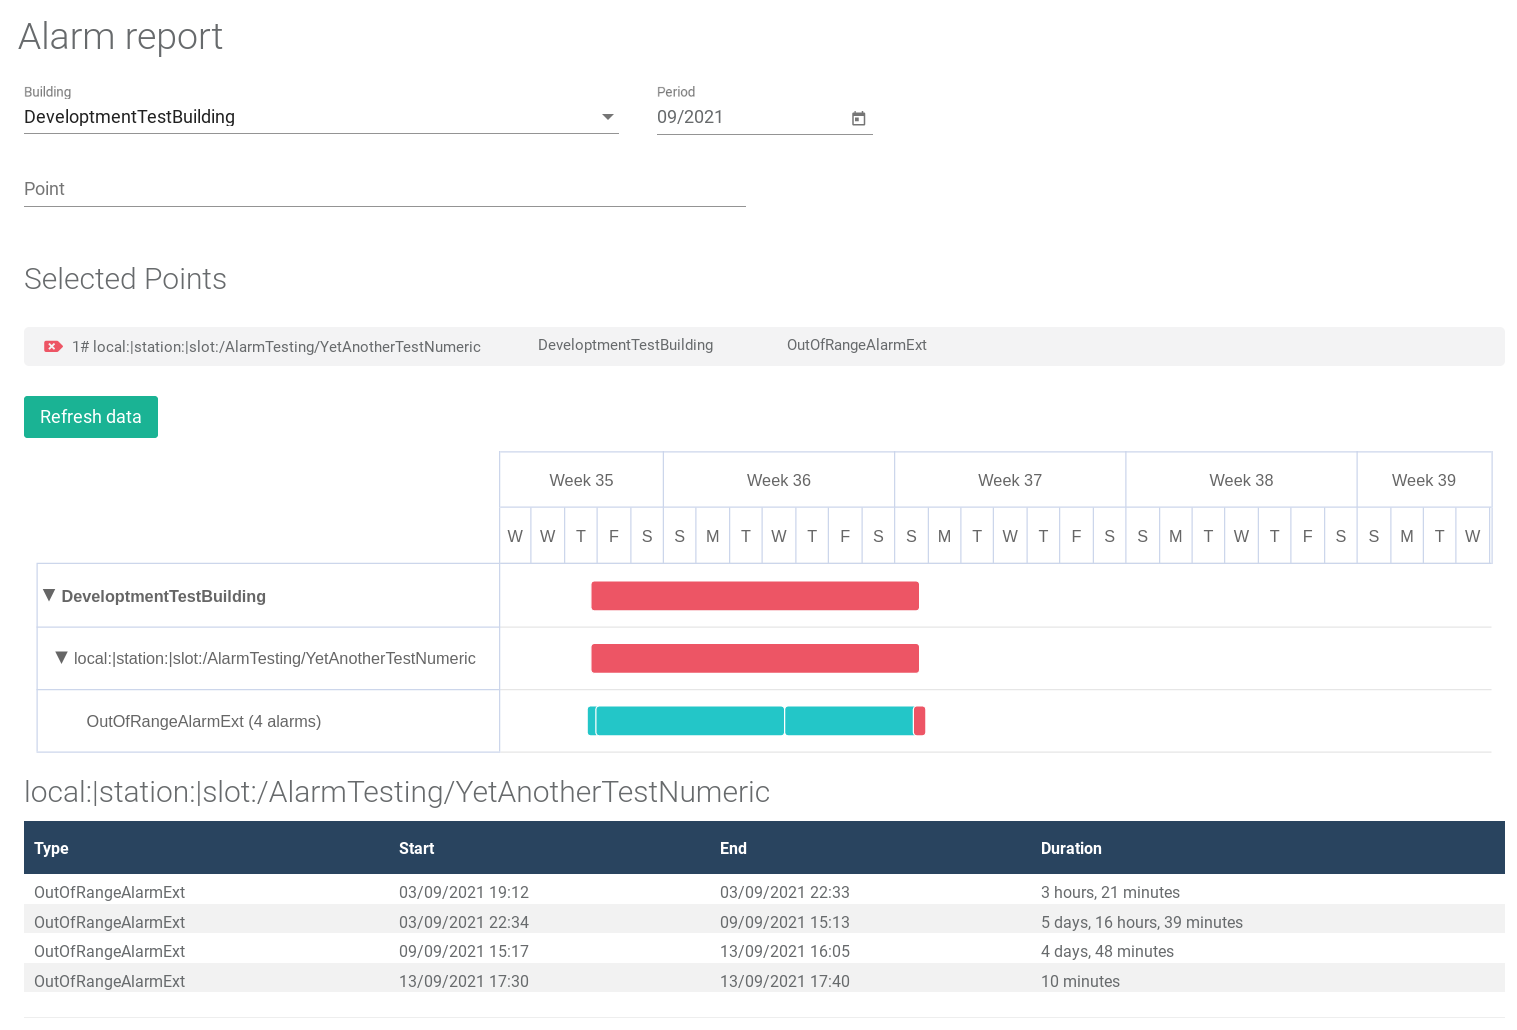
Each alarm can generate its own report for a view of the alarms activity over the selected month. This interface allows you to chart multiple alarms for cases where there is causality or correlation. This view also provides a nice visualization of alarm duration.
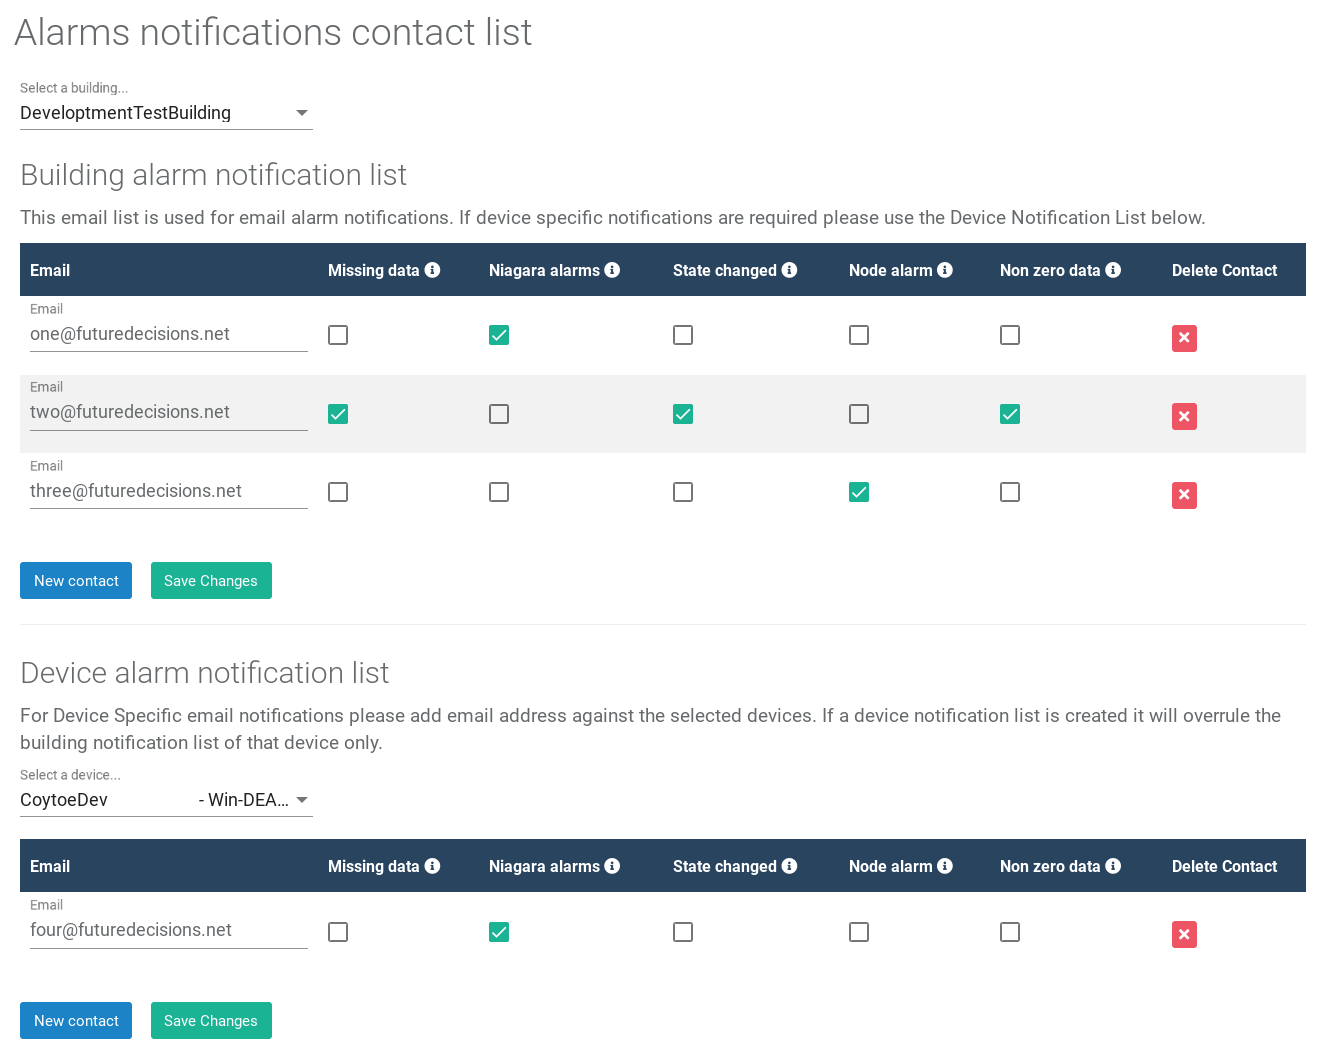
Alarm Notifications allows you to assign different people for different types of alarms or even alarms from specific devices. This includes integrity alarms.
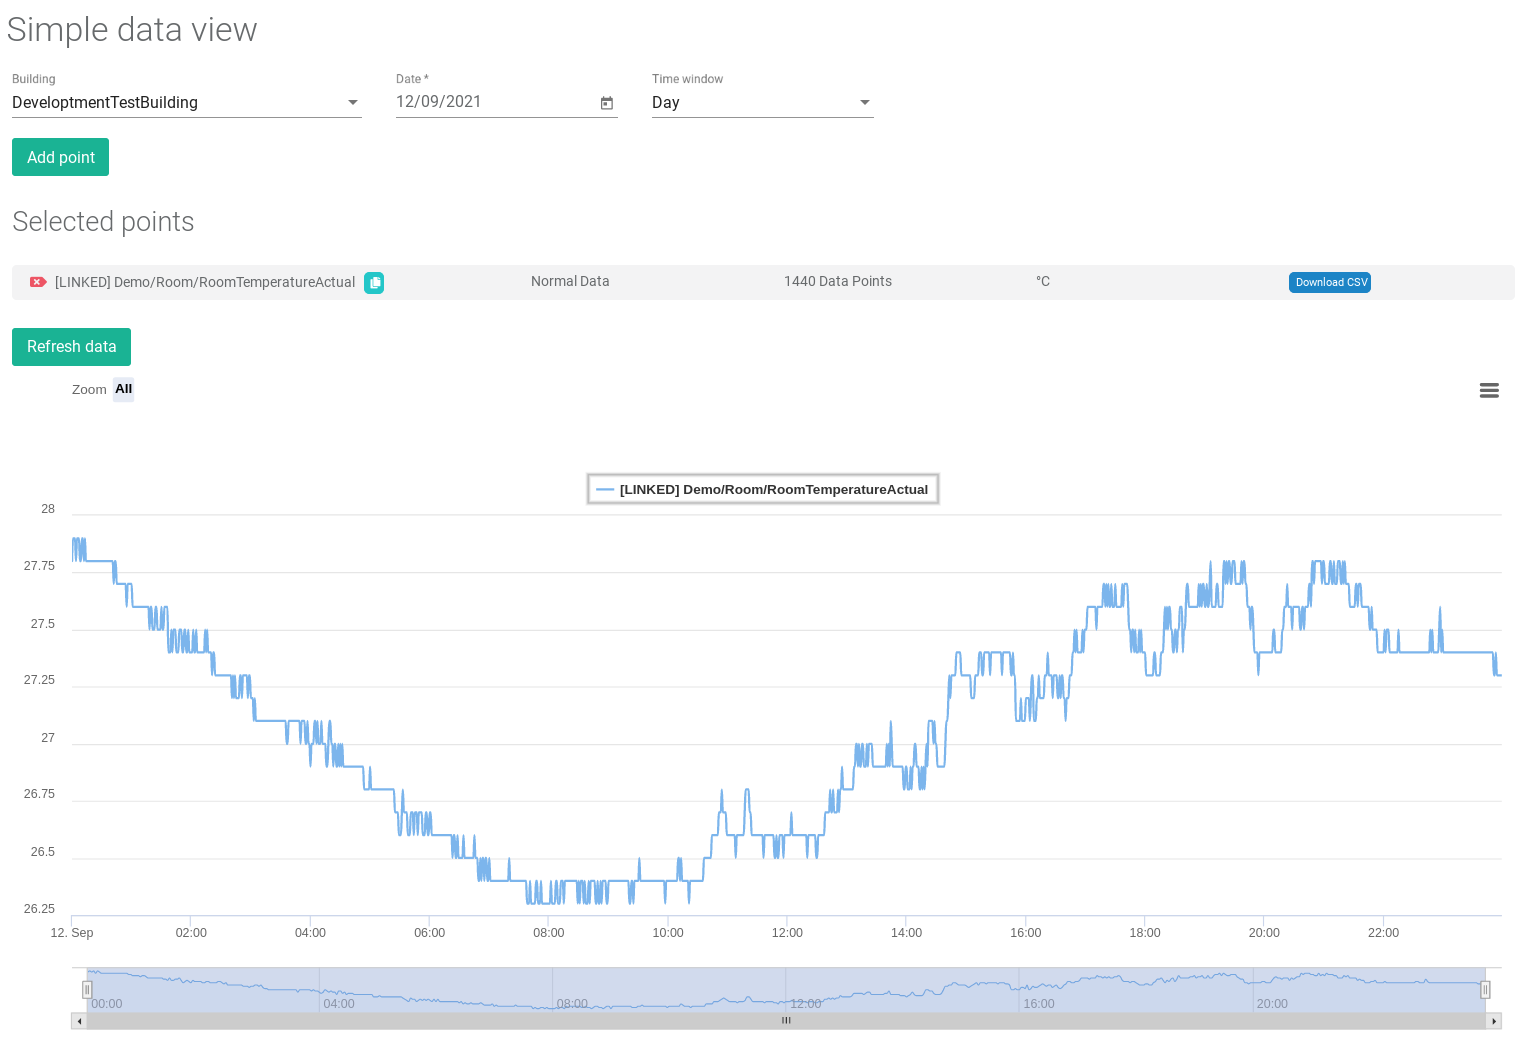
Any data point can be viewed as a chart within the platform (except string data). The charting allows you to chart multiple data points enabling you to easily investigate data relationships. All data can be downloaded as a CSV with a single click for easy access and sharing. For advanced data analysis, you can use the Data Advanced View which will allow significant control over the charting views and labelling.
Point Value Search is also listed under the data section menus allowing users to search for points using their value. For example, you could search for all meters that have a kWh value between 1000kWh and 1005 kWh. This helps with finding points and debugging poor naming conventions.
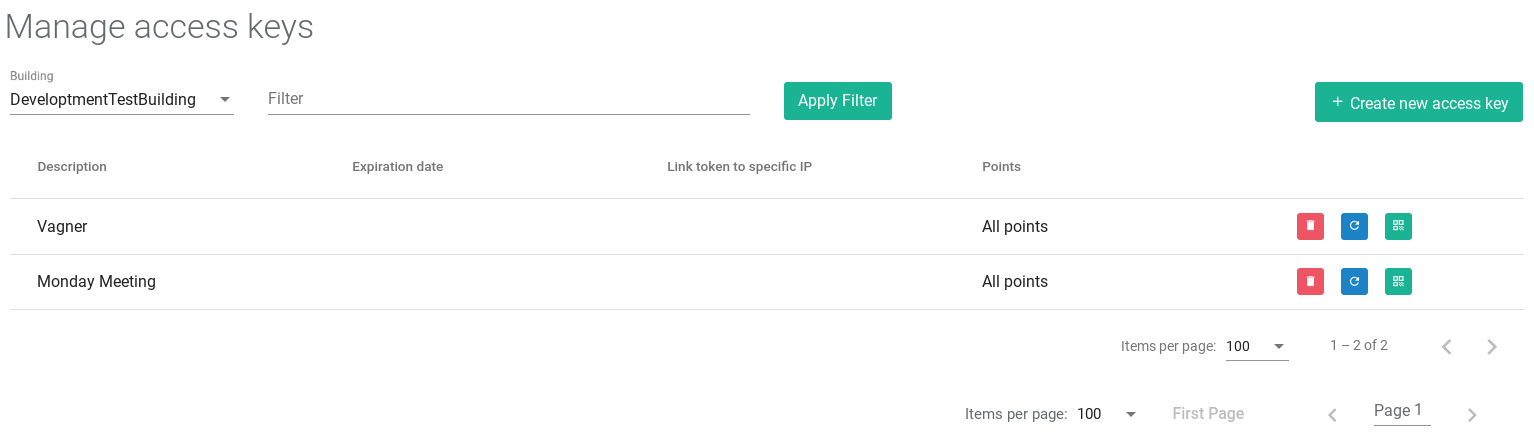
The Digital Building Platform contains its own API Server allowing you to securely share your data without providing access to your building’s network. Our enterprise-grade infrastructure is backed by AWS providing secure scalable and hassle-free API solutions with just a click.
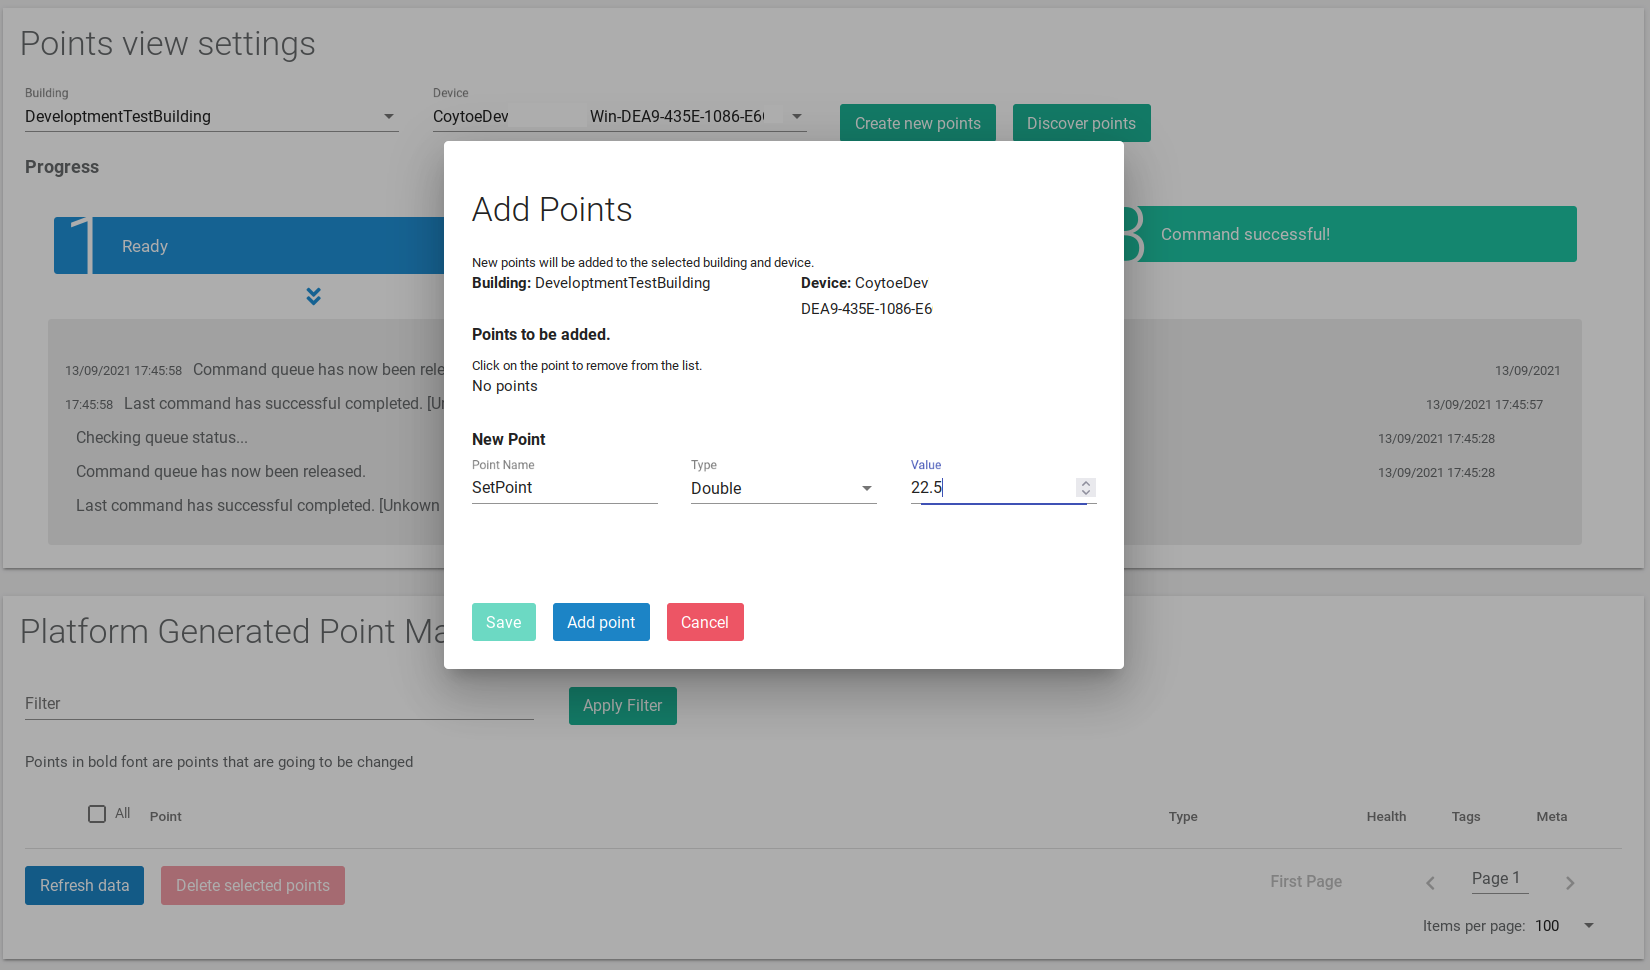
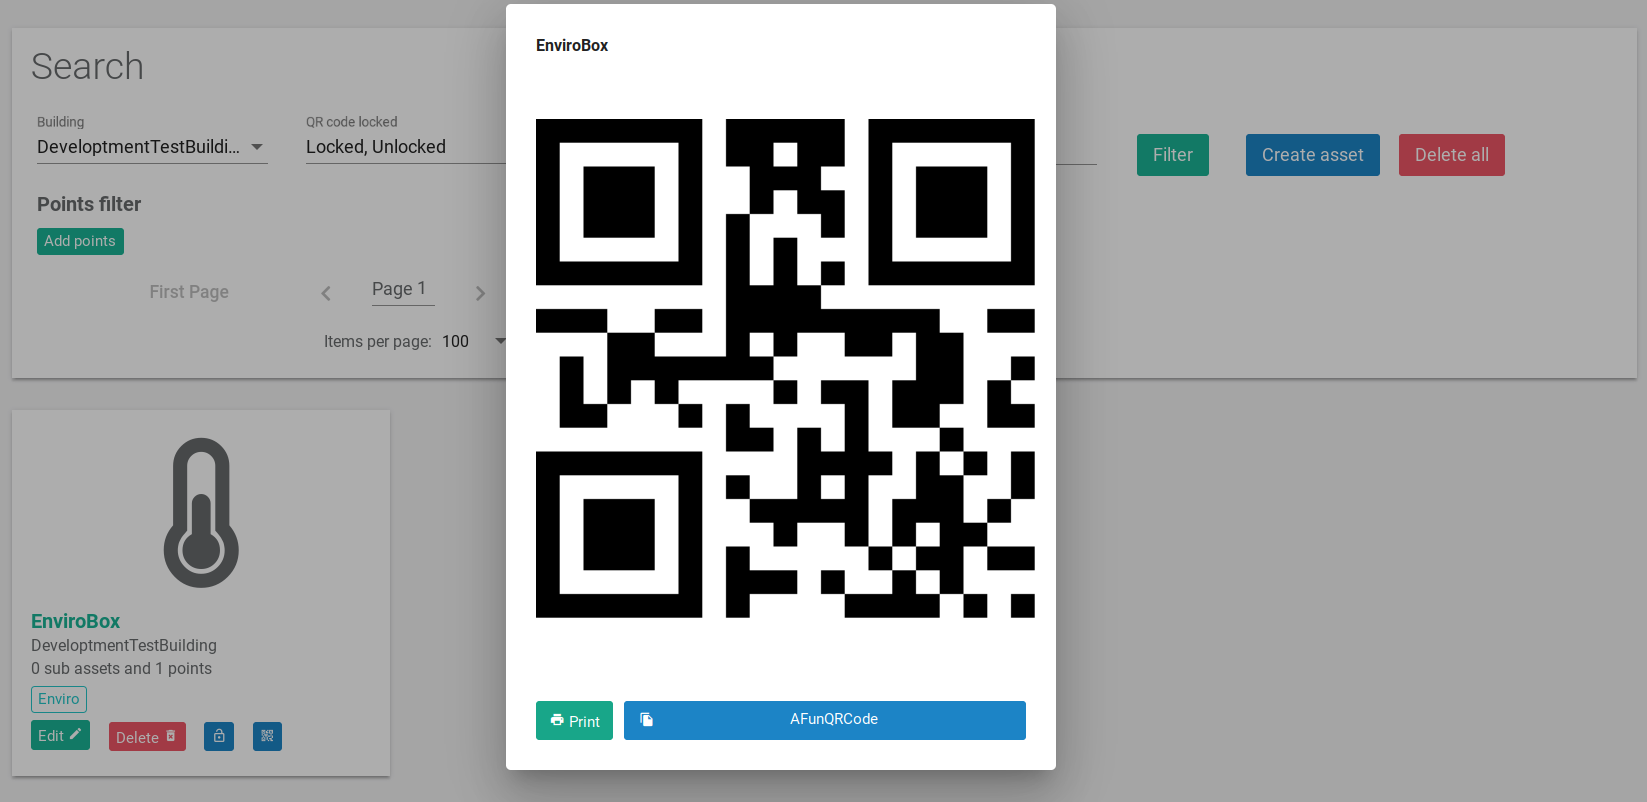
Remote Management allows you to discover and link points for the Digital Building Platform from your browser. You can also create points from the platform allowing you to set numeric, booleans and starting points. Remote Management also allows you to manage devices and view application director logs all from a web page.
Assets and Grouping organise data into contextually aware asserts for both easy management but also for advanced analytics. Grouping assets allows you to perform peer group analysis to identify poor performing units. Assets classification allows for individual unit analysis.
The concept of assets is fundamental to the advanced operations within the digital Building Platform but also good point data management.
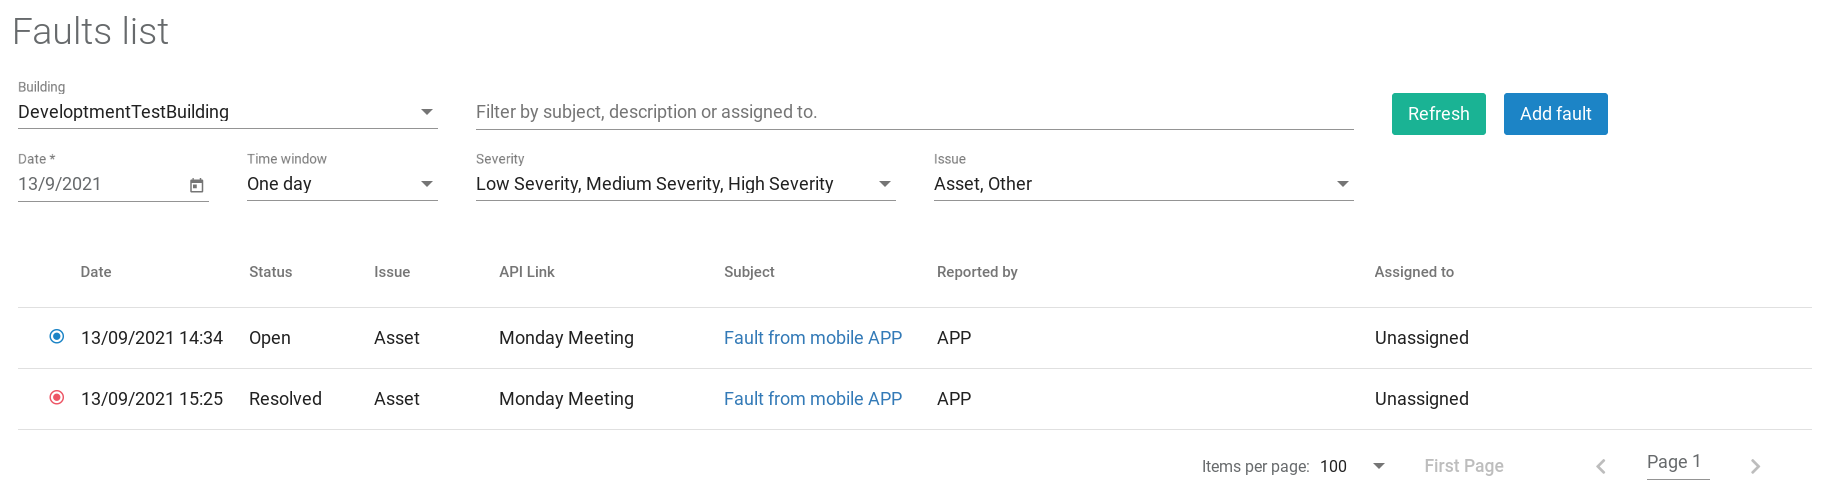
The Fault Management section of the Digital Building Platform integrates with the Building Assistant Android and iOS apps. This section provides a full fault management bureau capability where users can add faults from the webpage or the apps. Faults can be prioritised and assigned to individuals. If a fault is linked to an asset there is a one-click feature to see the data from the asset points at the time of the fault submission. An asset fault history is also kept to help monitor recurring issues.
The fault reporting section provides a monthly view of the number of faults, fault types, time to resolution and more empowering you when making maintenance decisions. A data-driven approach.
If you have questions please get in touch via email or phone.
R120, LO24, Reading University
London Road, RG1 5AQ, UK