
The Future Decisions Building Assistant App makes your BMS data tasks easy. This app will save you time, energy and money. No more VPN’s, missing passwords, laptops and odd versions of software. All you need is your phone.
The app links to the Digital Building Platform allowing the user to add all buildings for which they have
sufficient privileges.
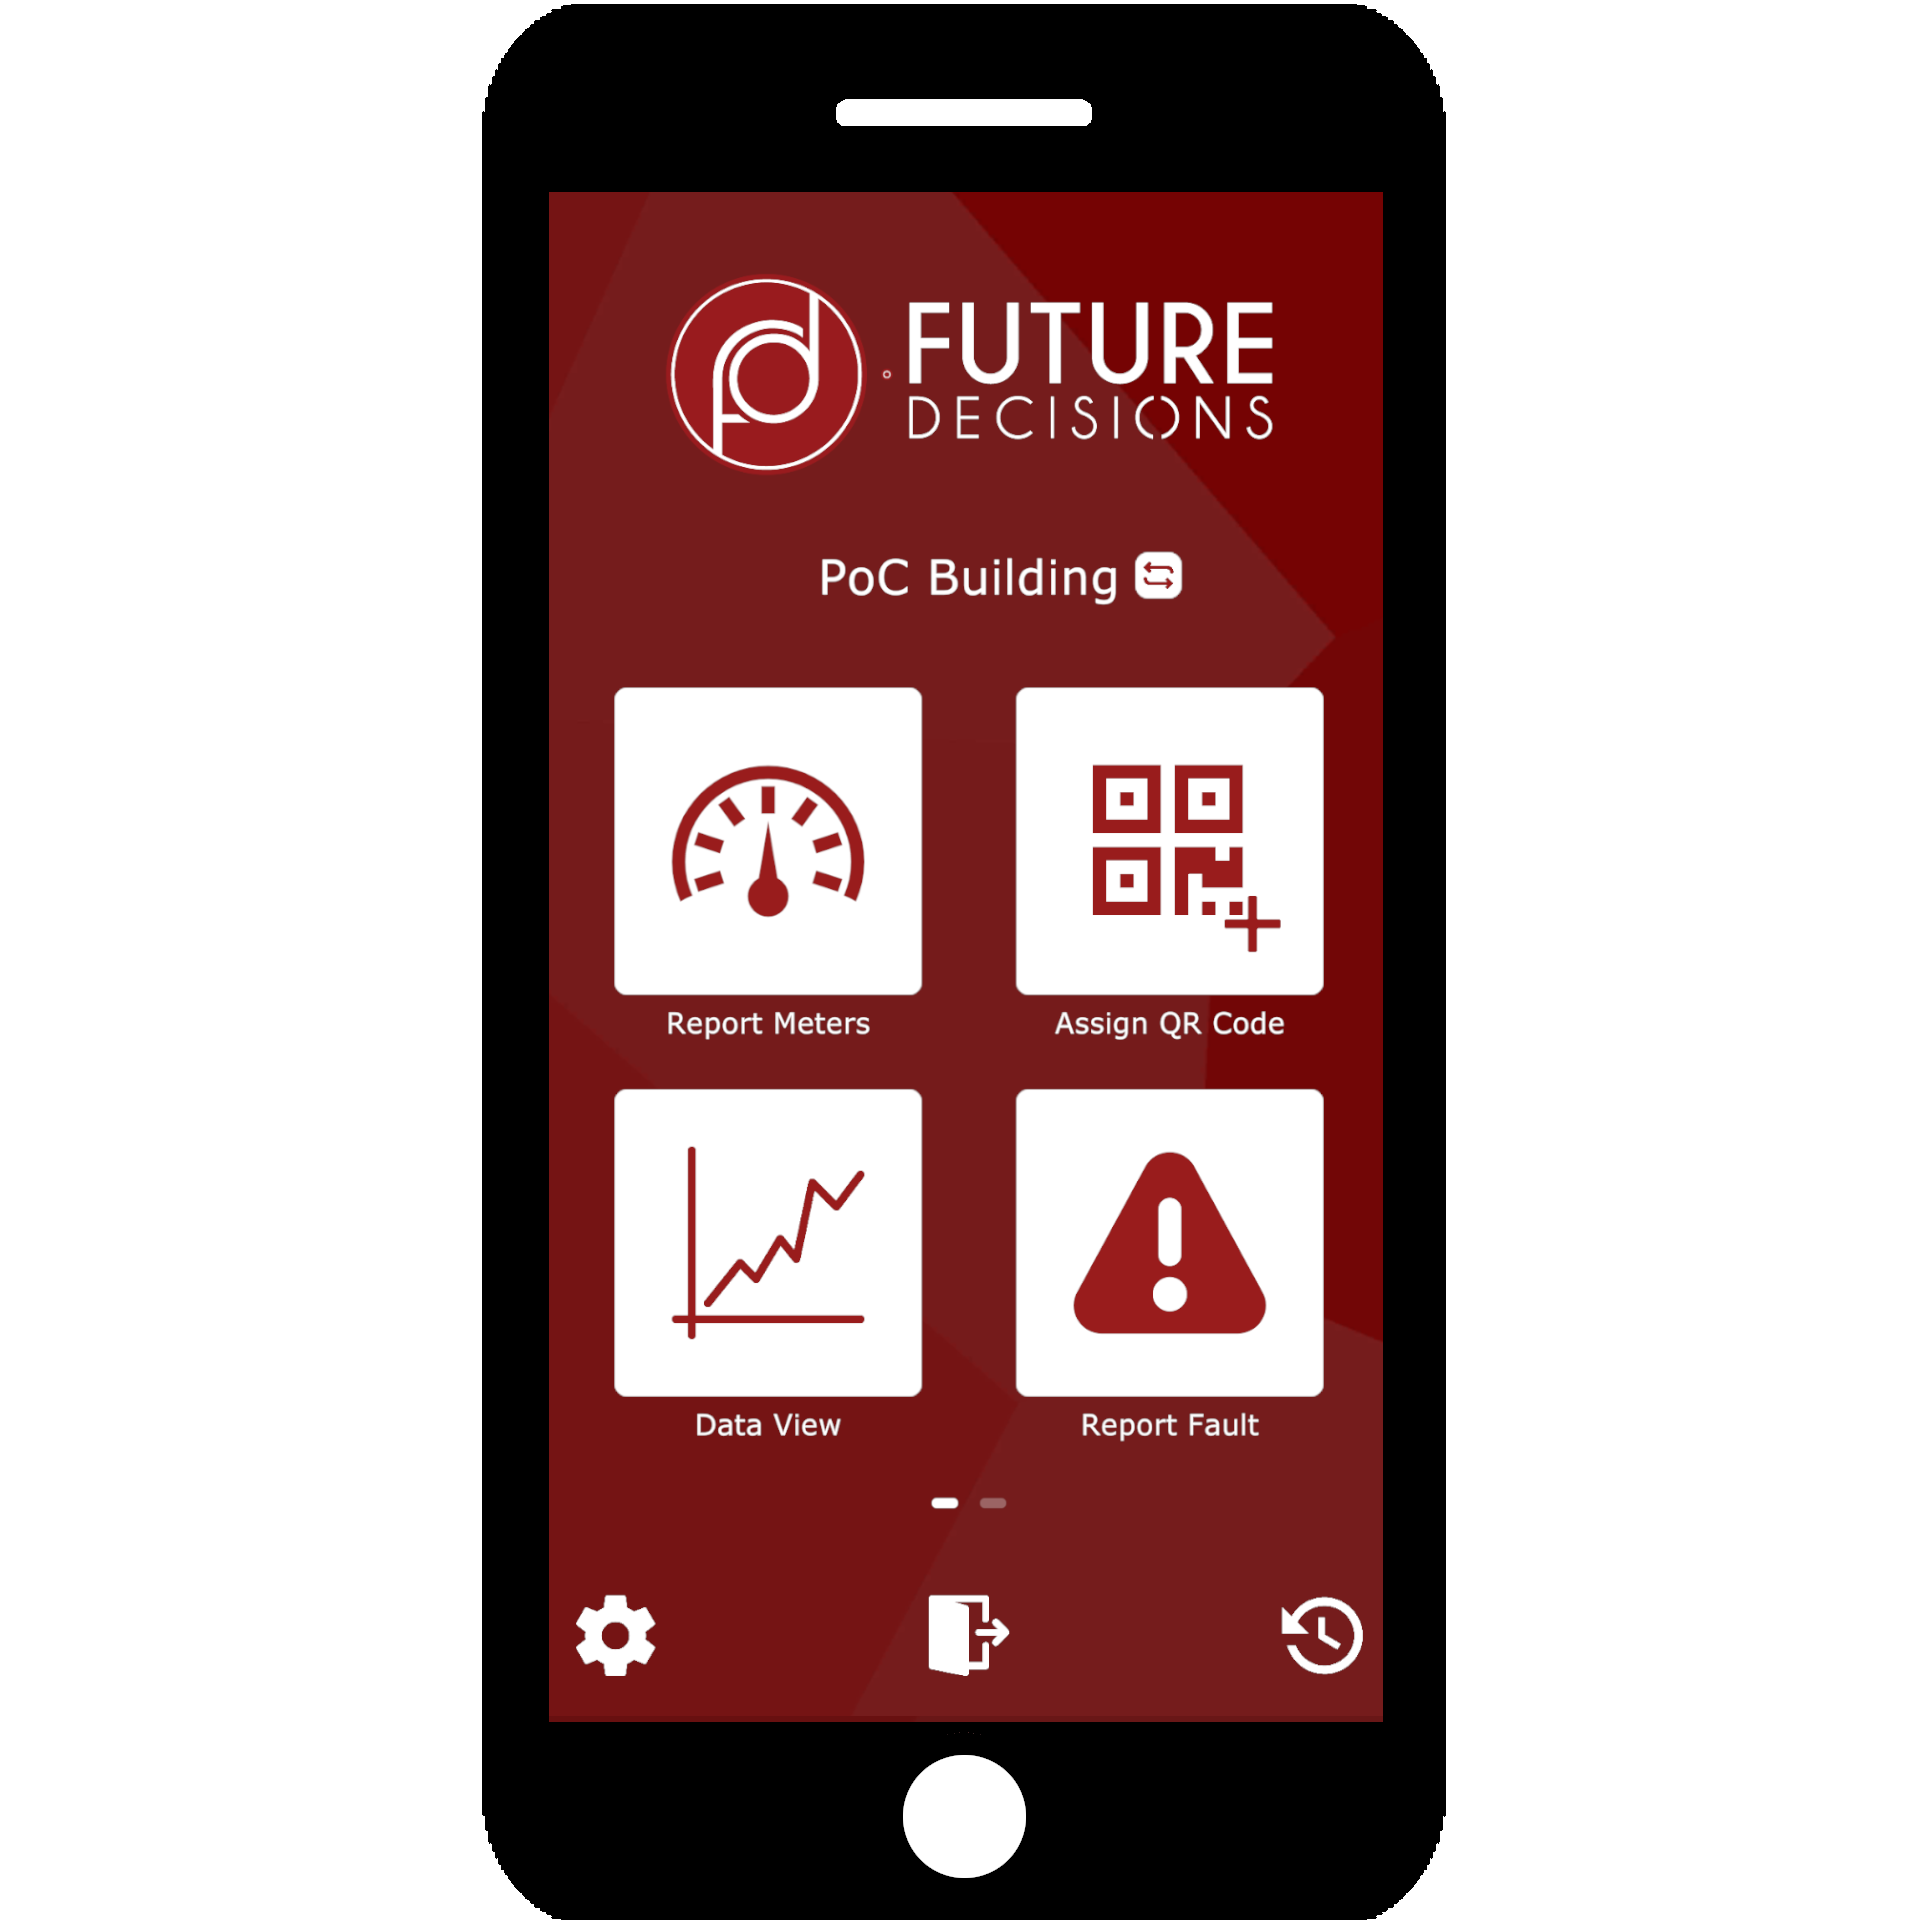
The main menu presents the user options for tagging assets, viewing point data, reporting faults and
calibrating meters. In addition, a search by value feature allows you to find data points by their value
particularly useful if you suspect meter points have been mislabeled.
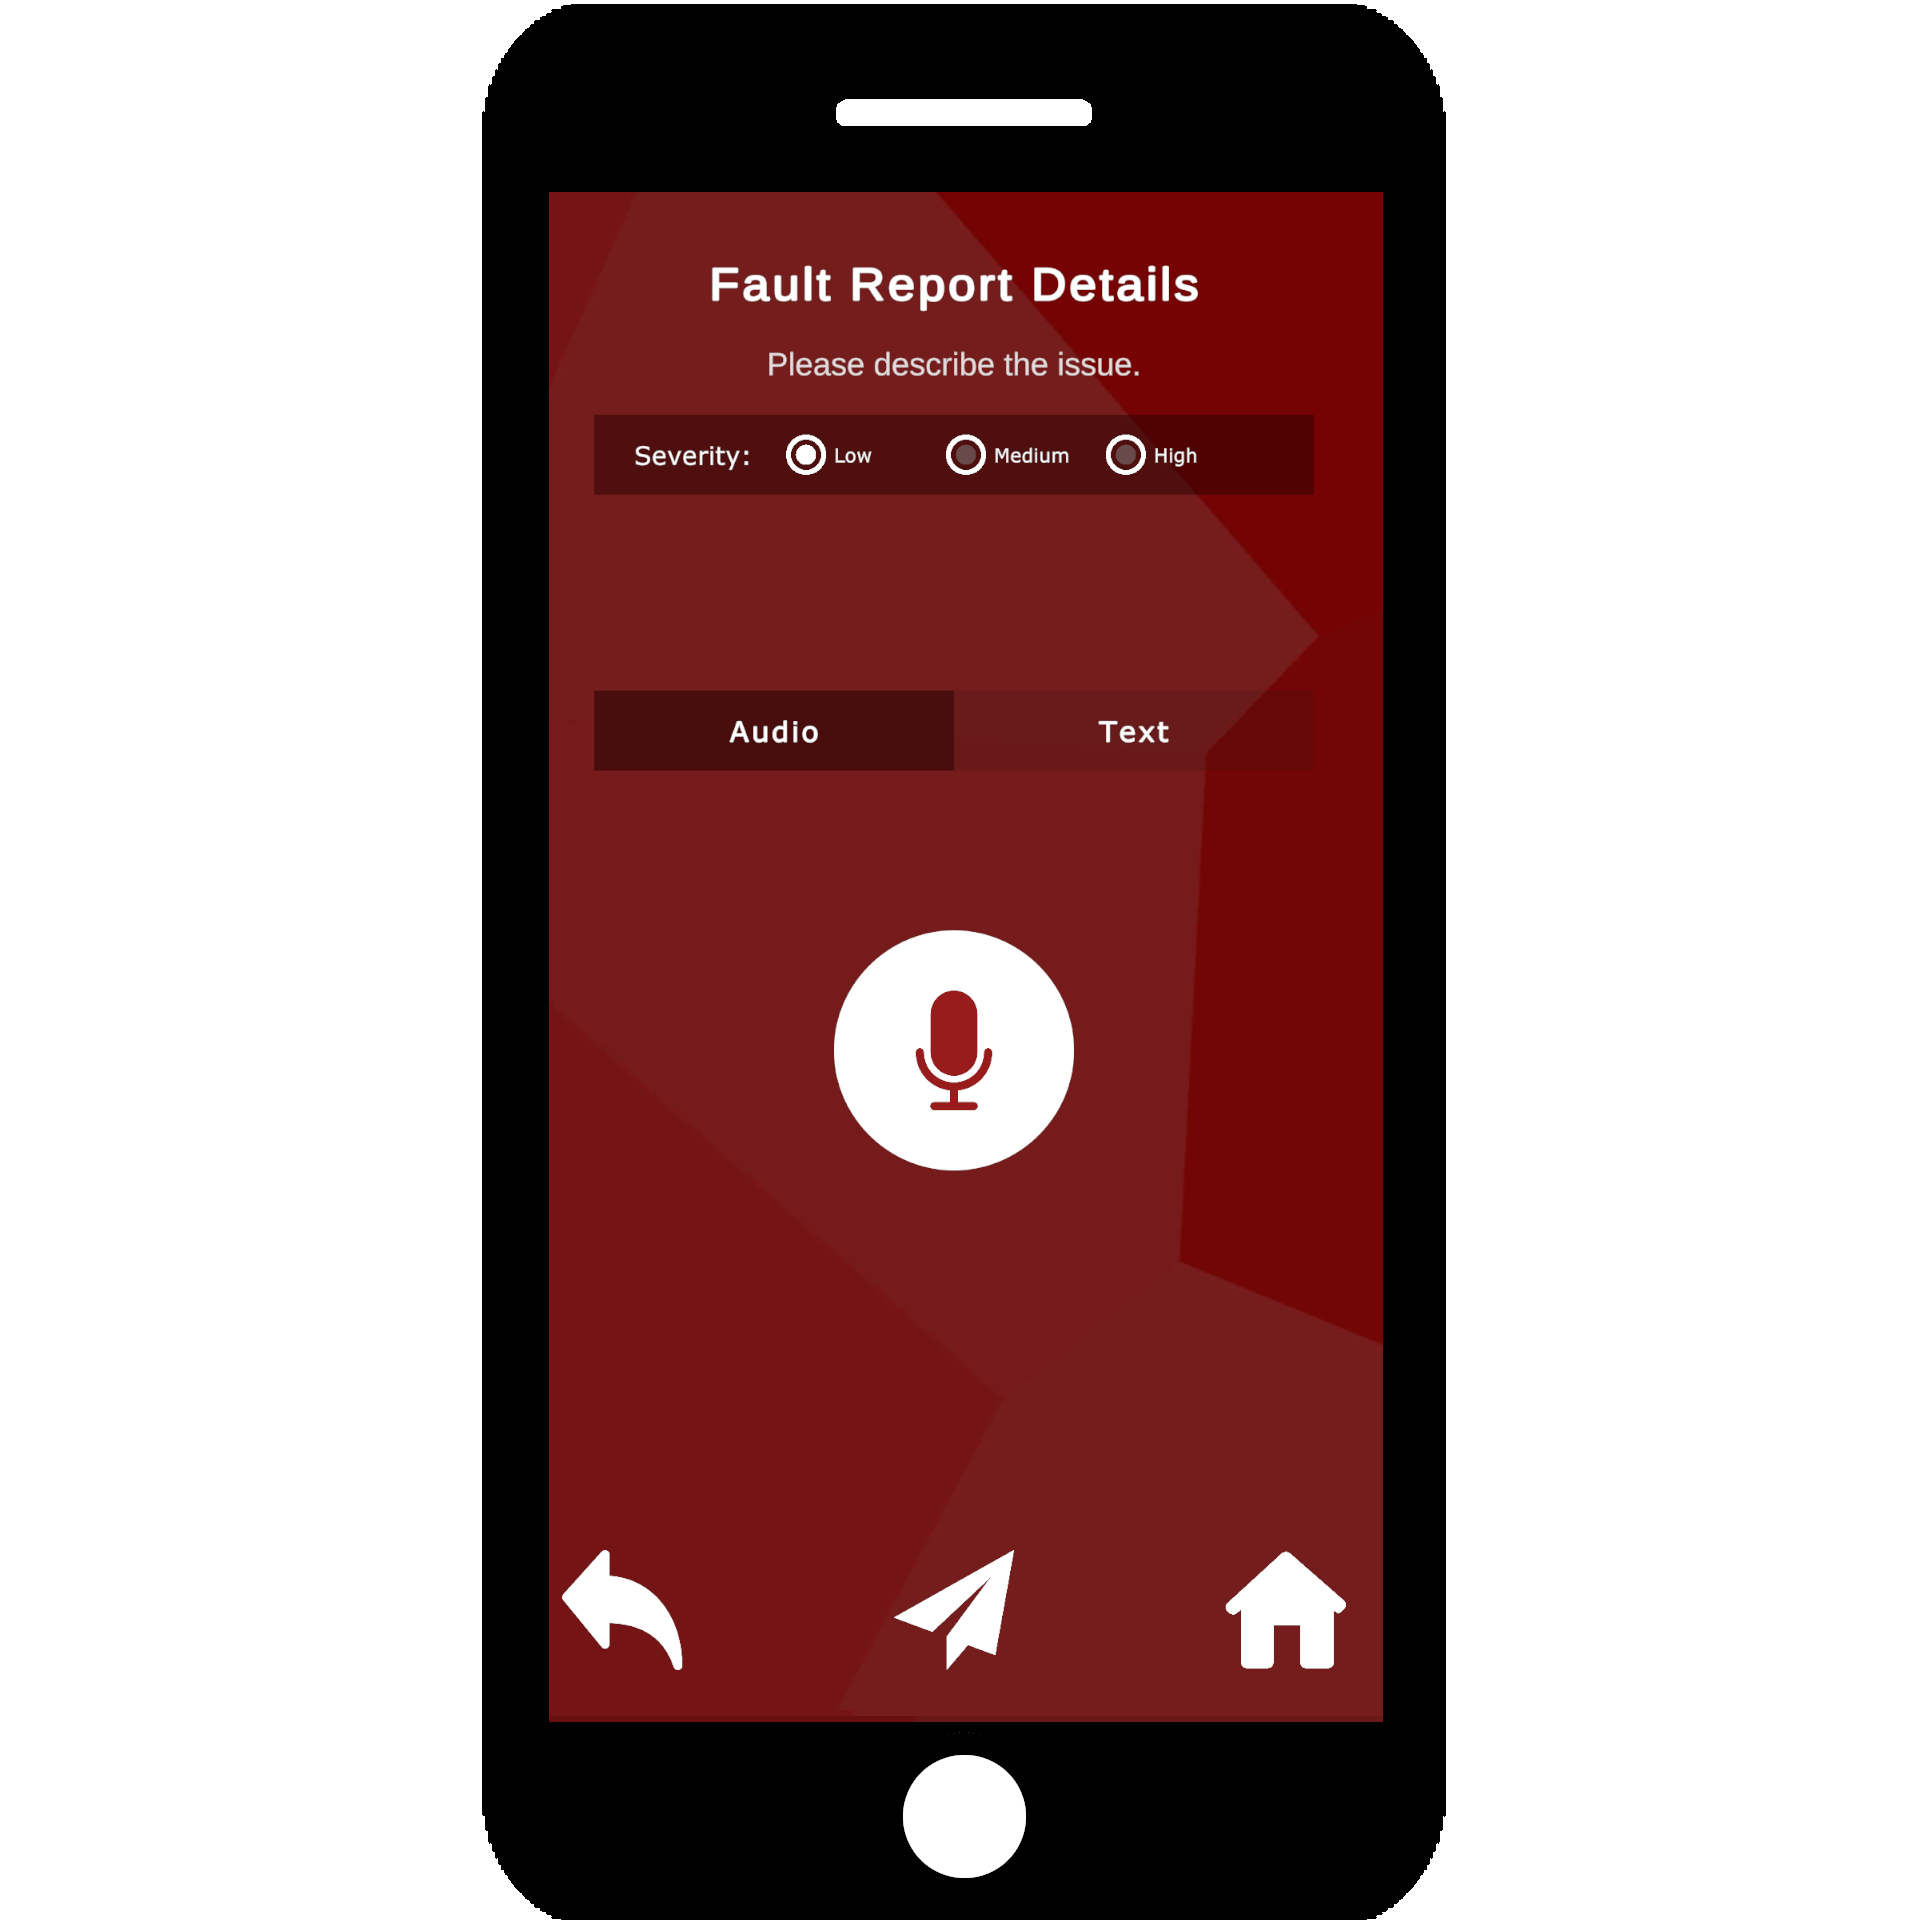
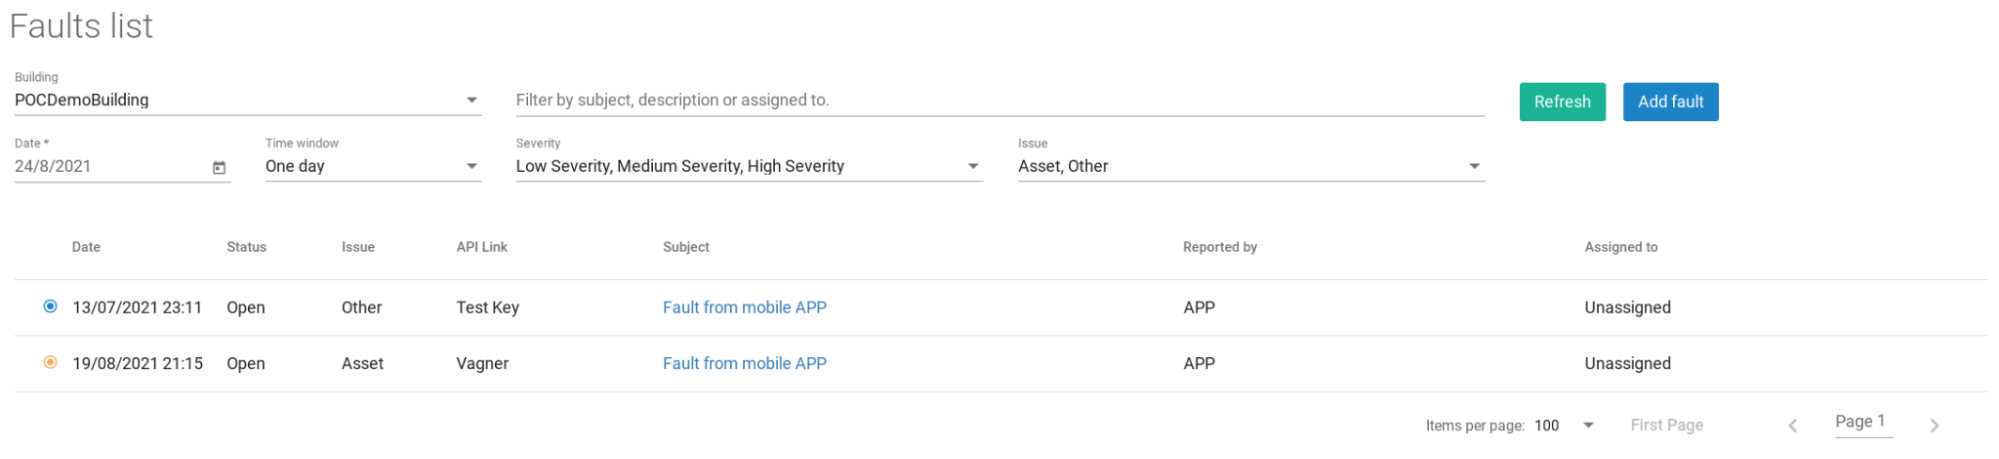
The user can scan the faulty asset (if tagged) and set the fault severity as either low, medium or high. The details of the fault can then be either typed or dictated after which it is then sent to the fault management bureau service (included with the digital building platform). The fault can then be investigated given the data stored within the platform and responsibility assigned to the appropriate person for resolution.
When an asset is scanned (such as an FCU) the app will display each data point belonging to the asset. The user is presented with the latest values from each point and the timestamp of the reading. Selecting a data point provides a chart and a historic view of that data point.
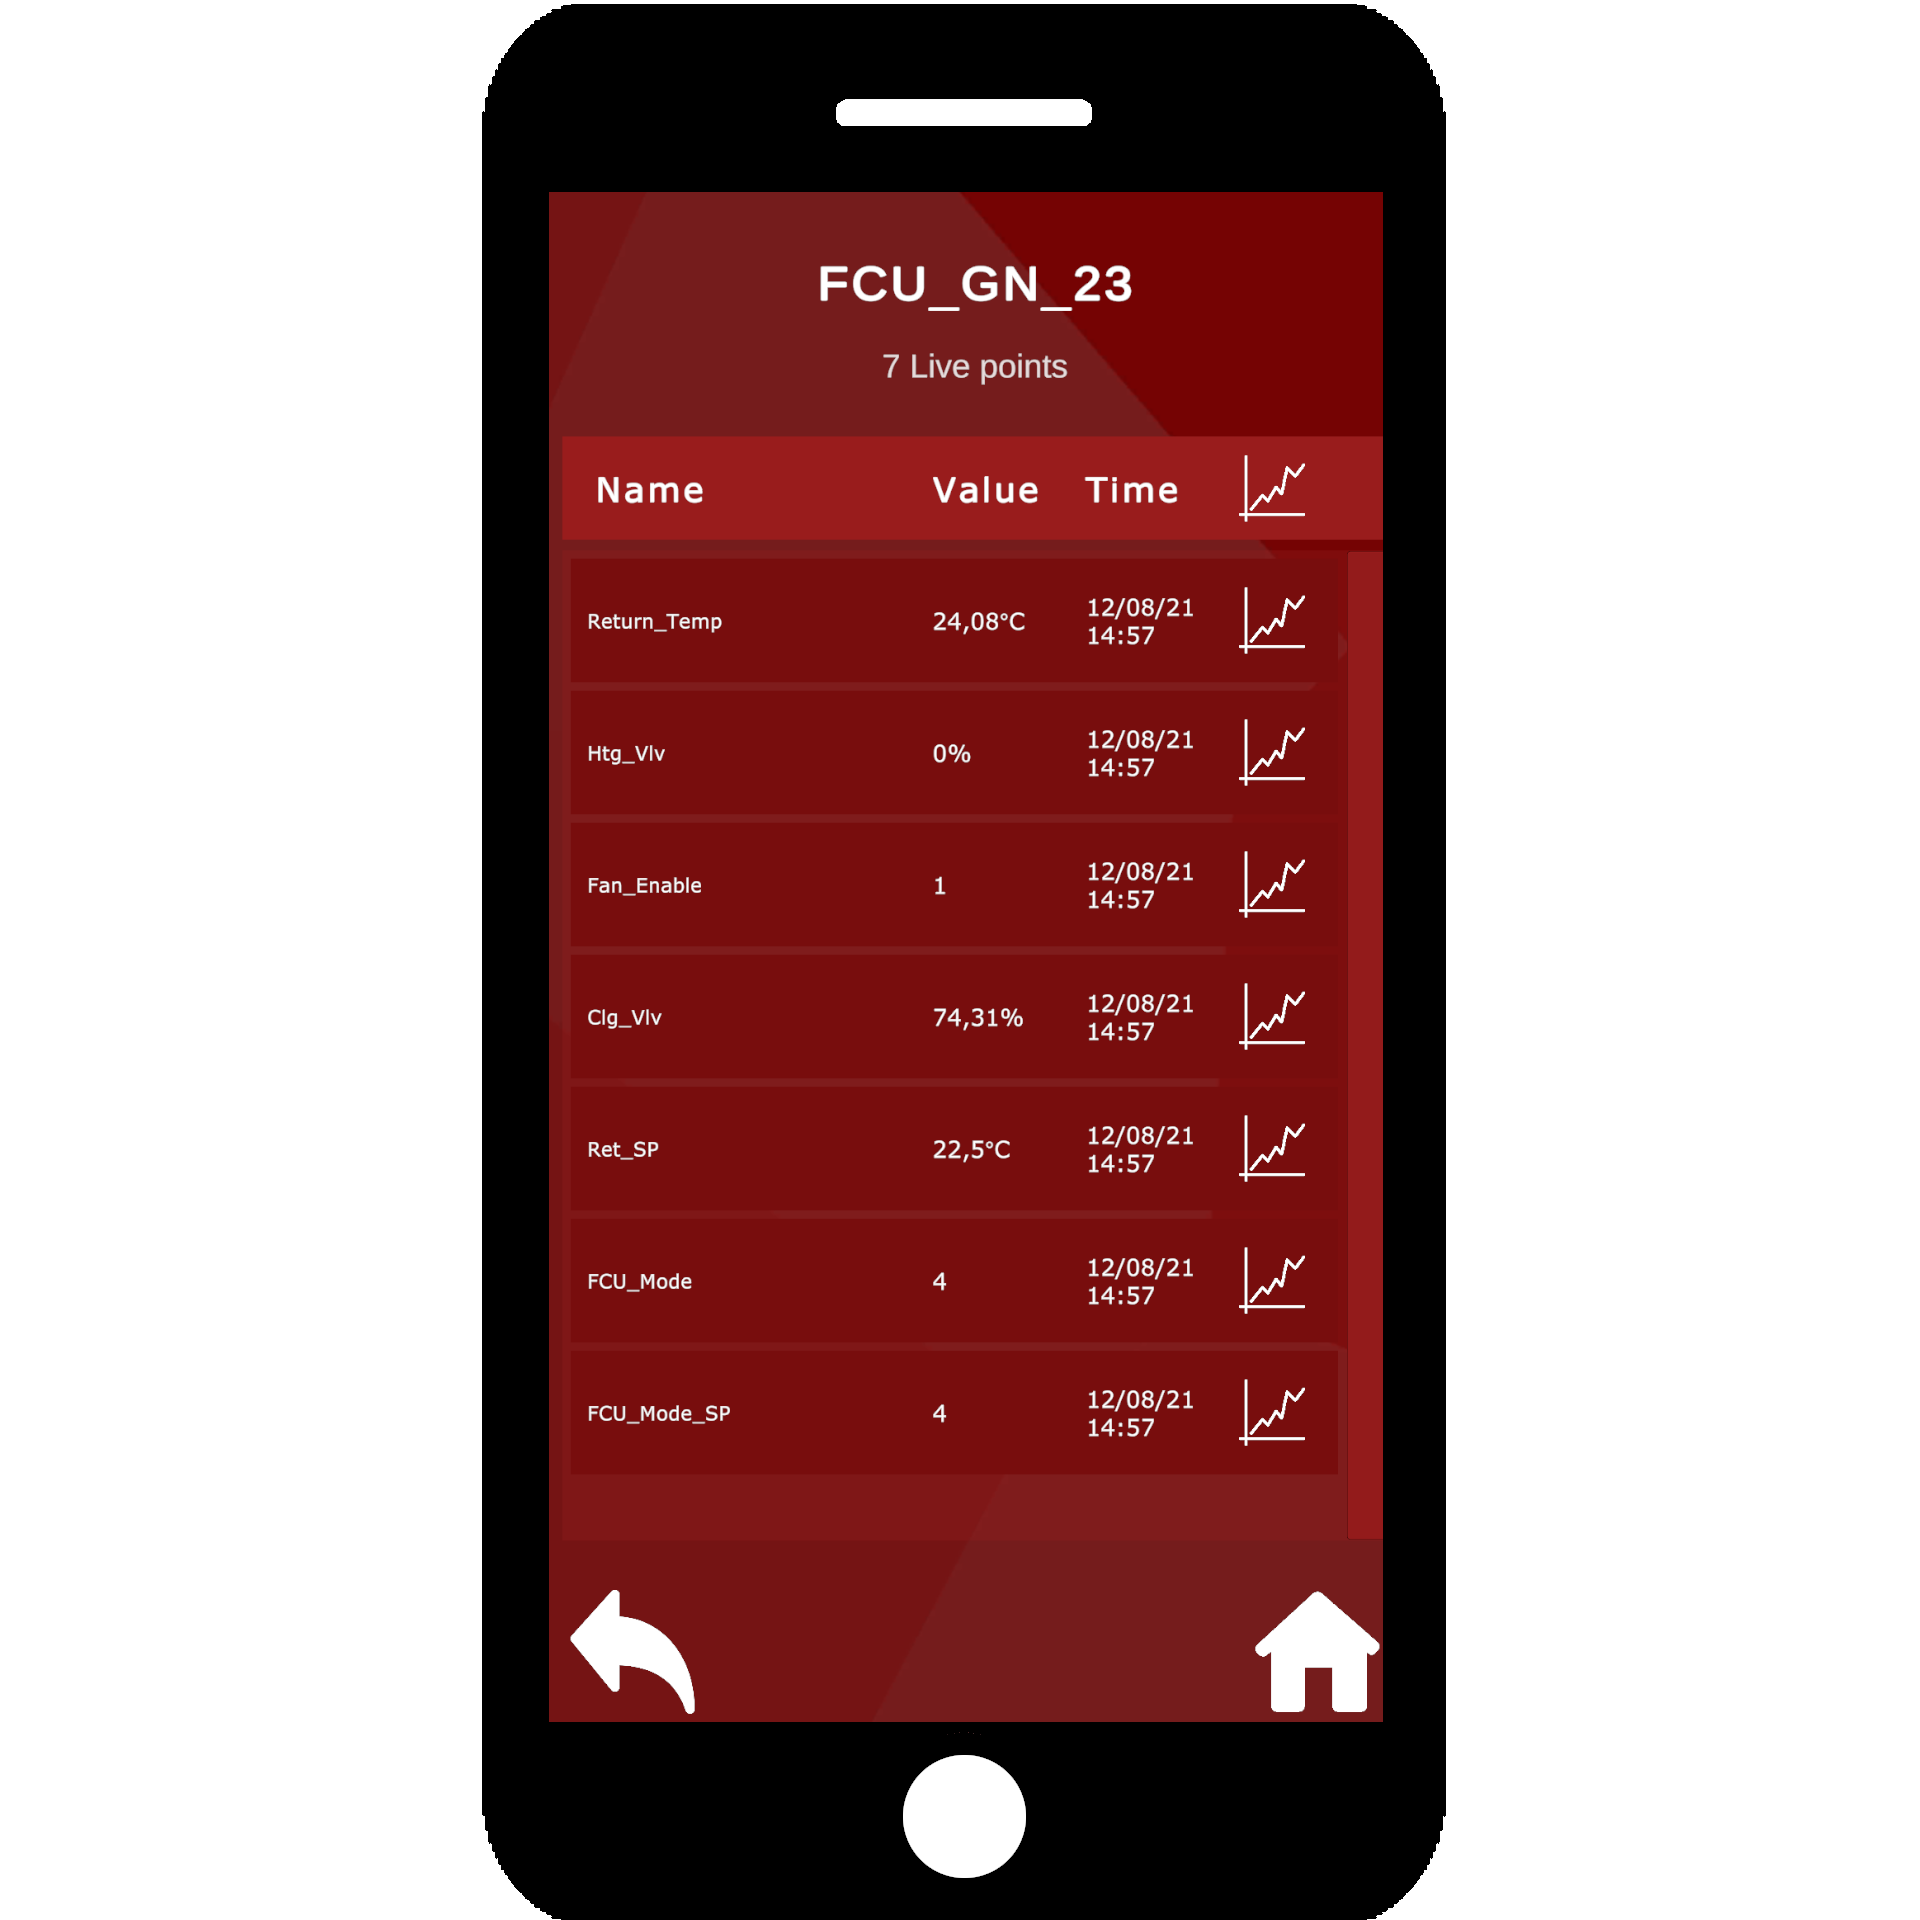
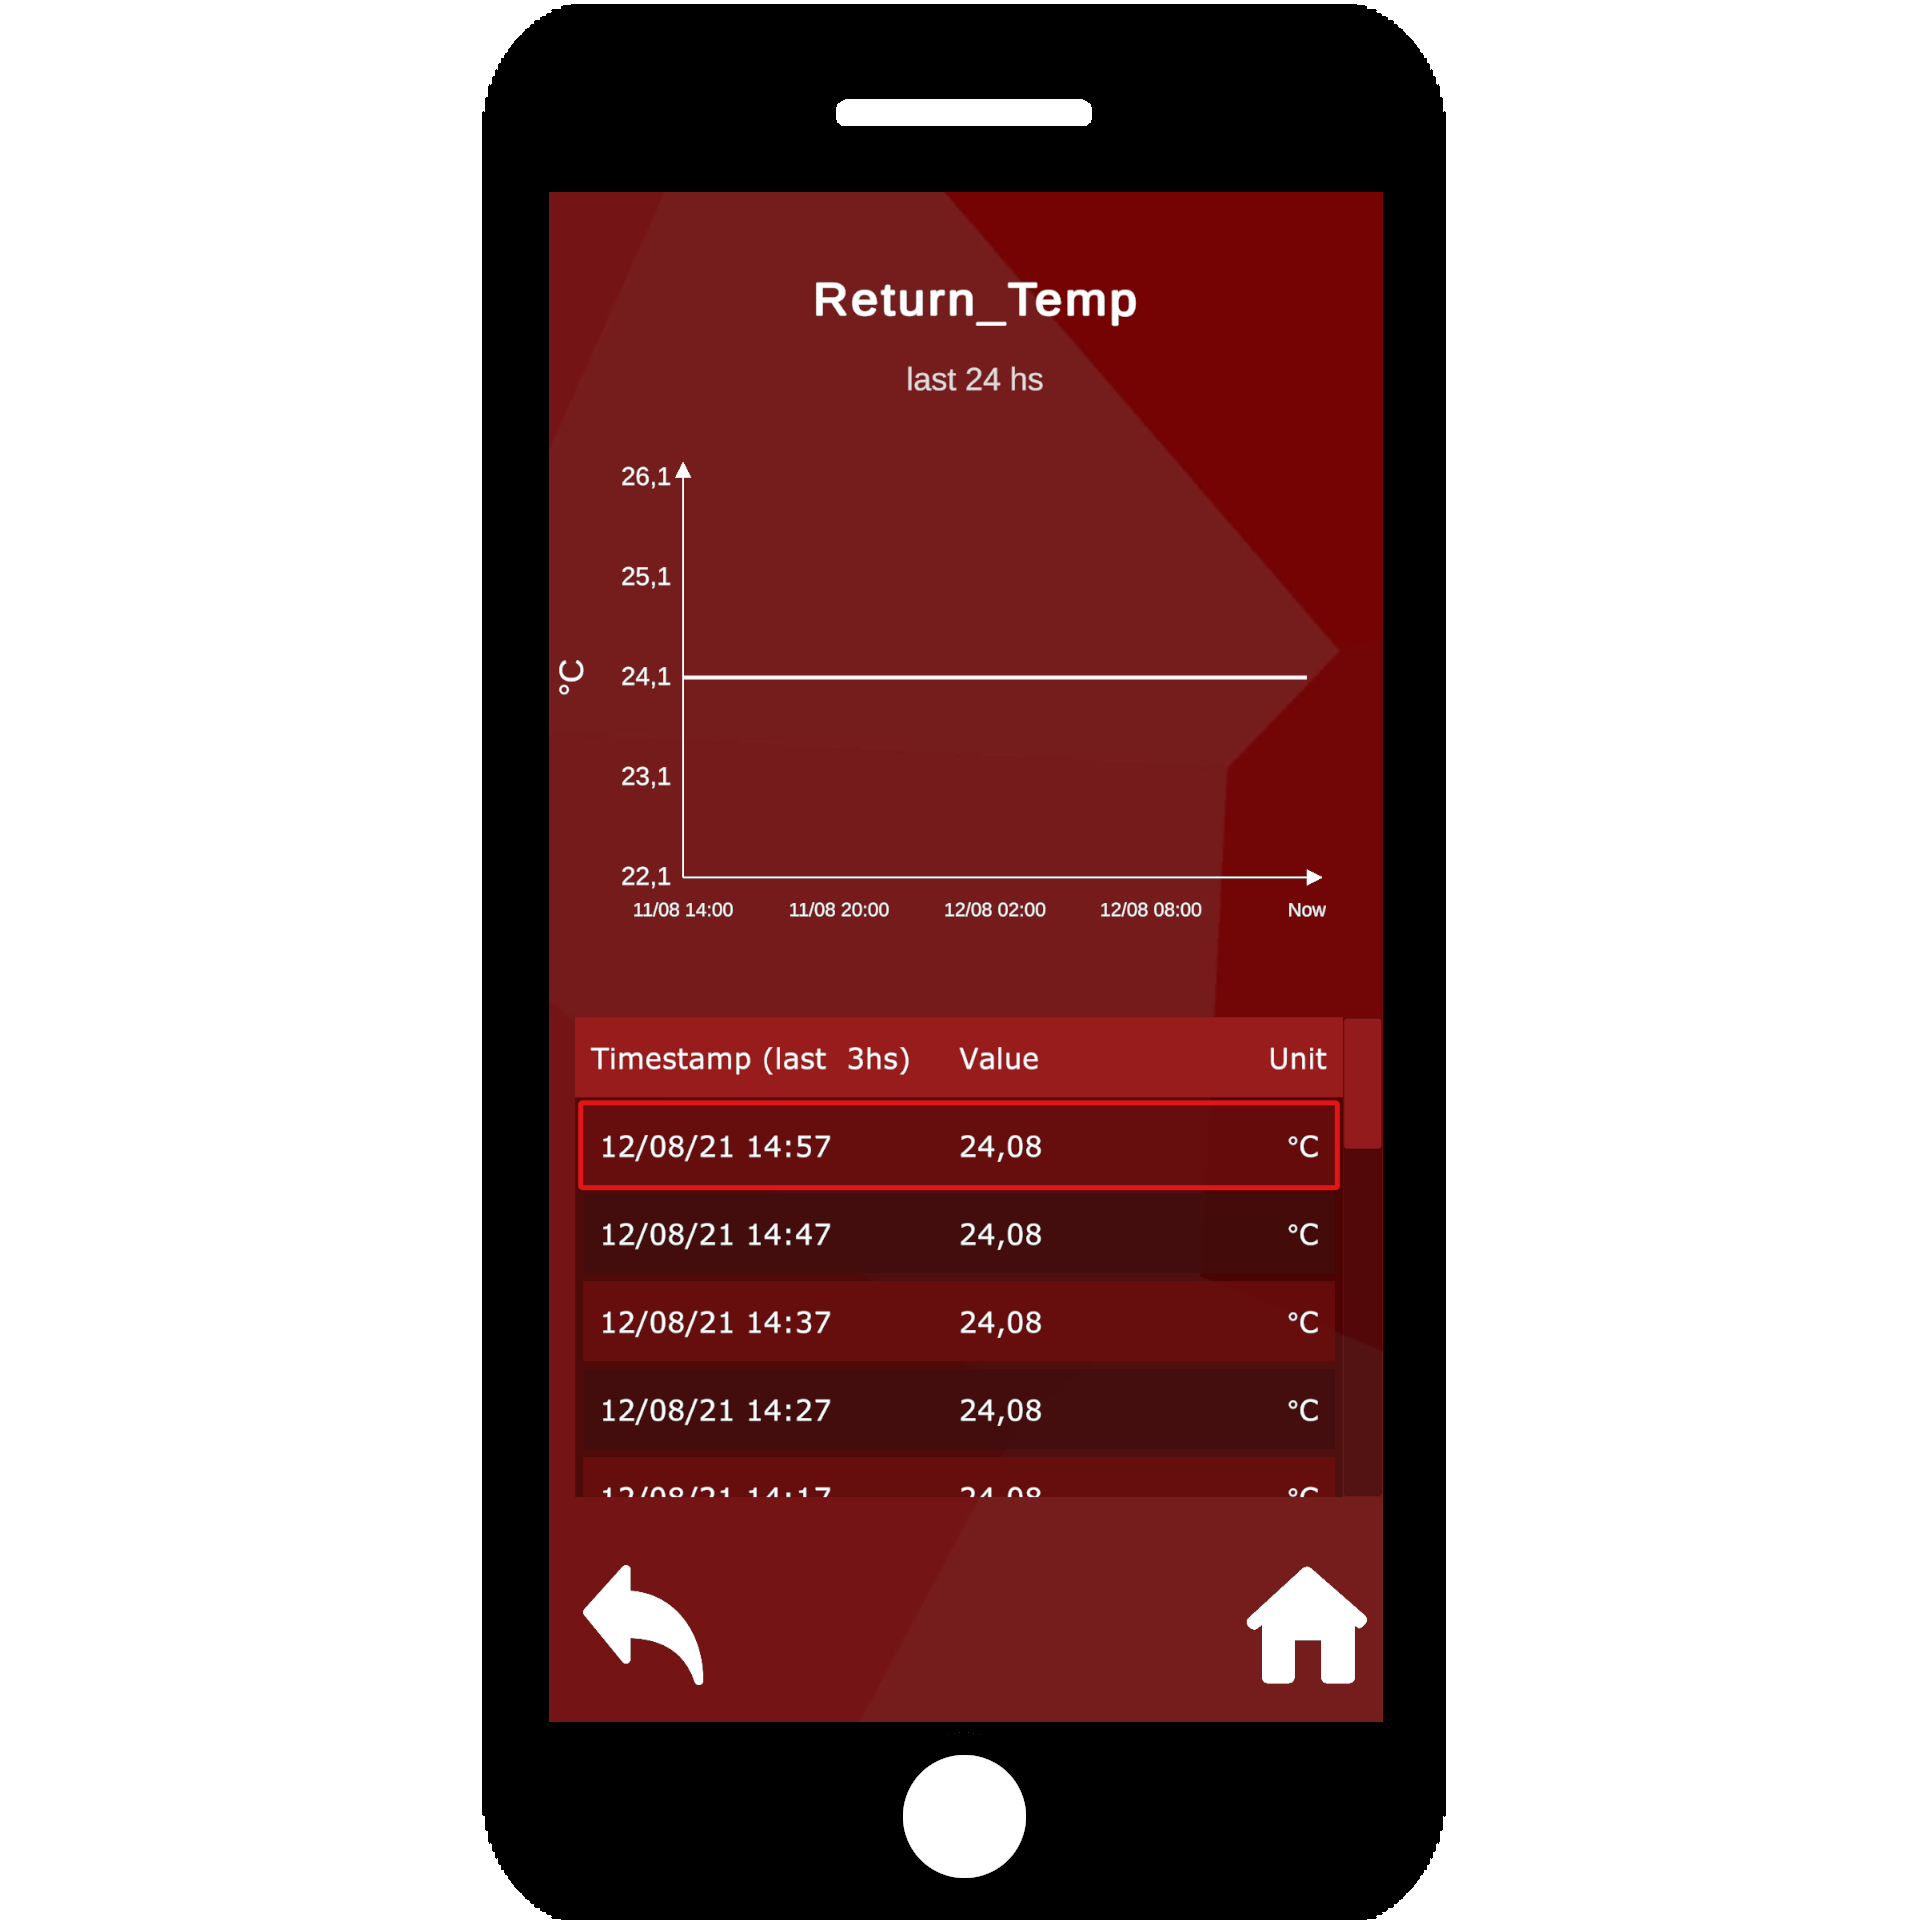
If the data point chart view is selected you will be presented with a three-hour history of that data point in both chart and list view. This is particularly useful when diagnosing intermittent issues on site.
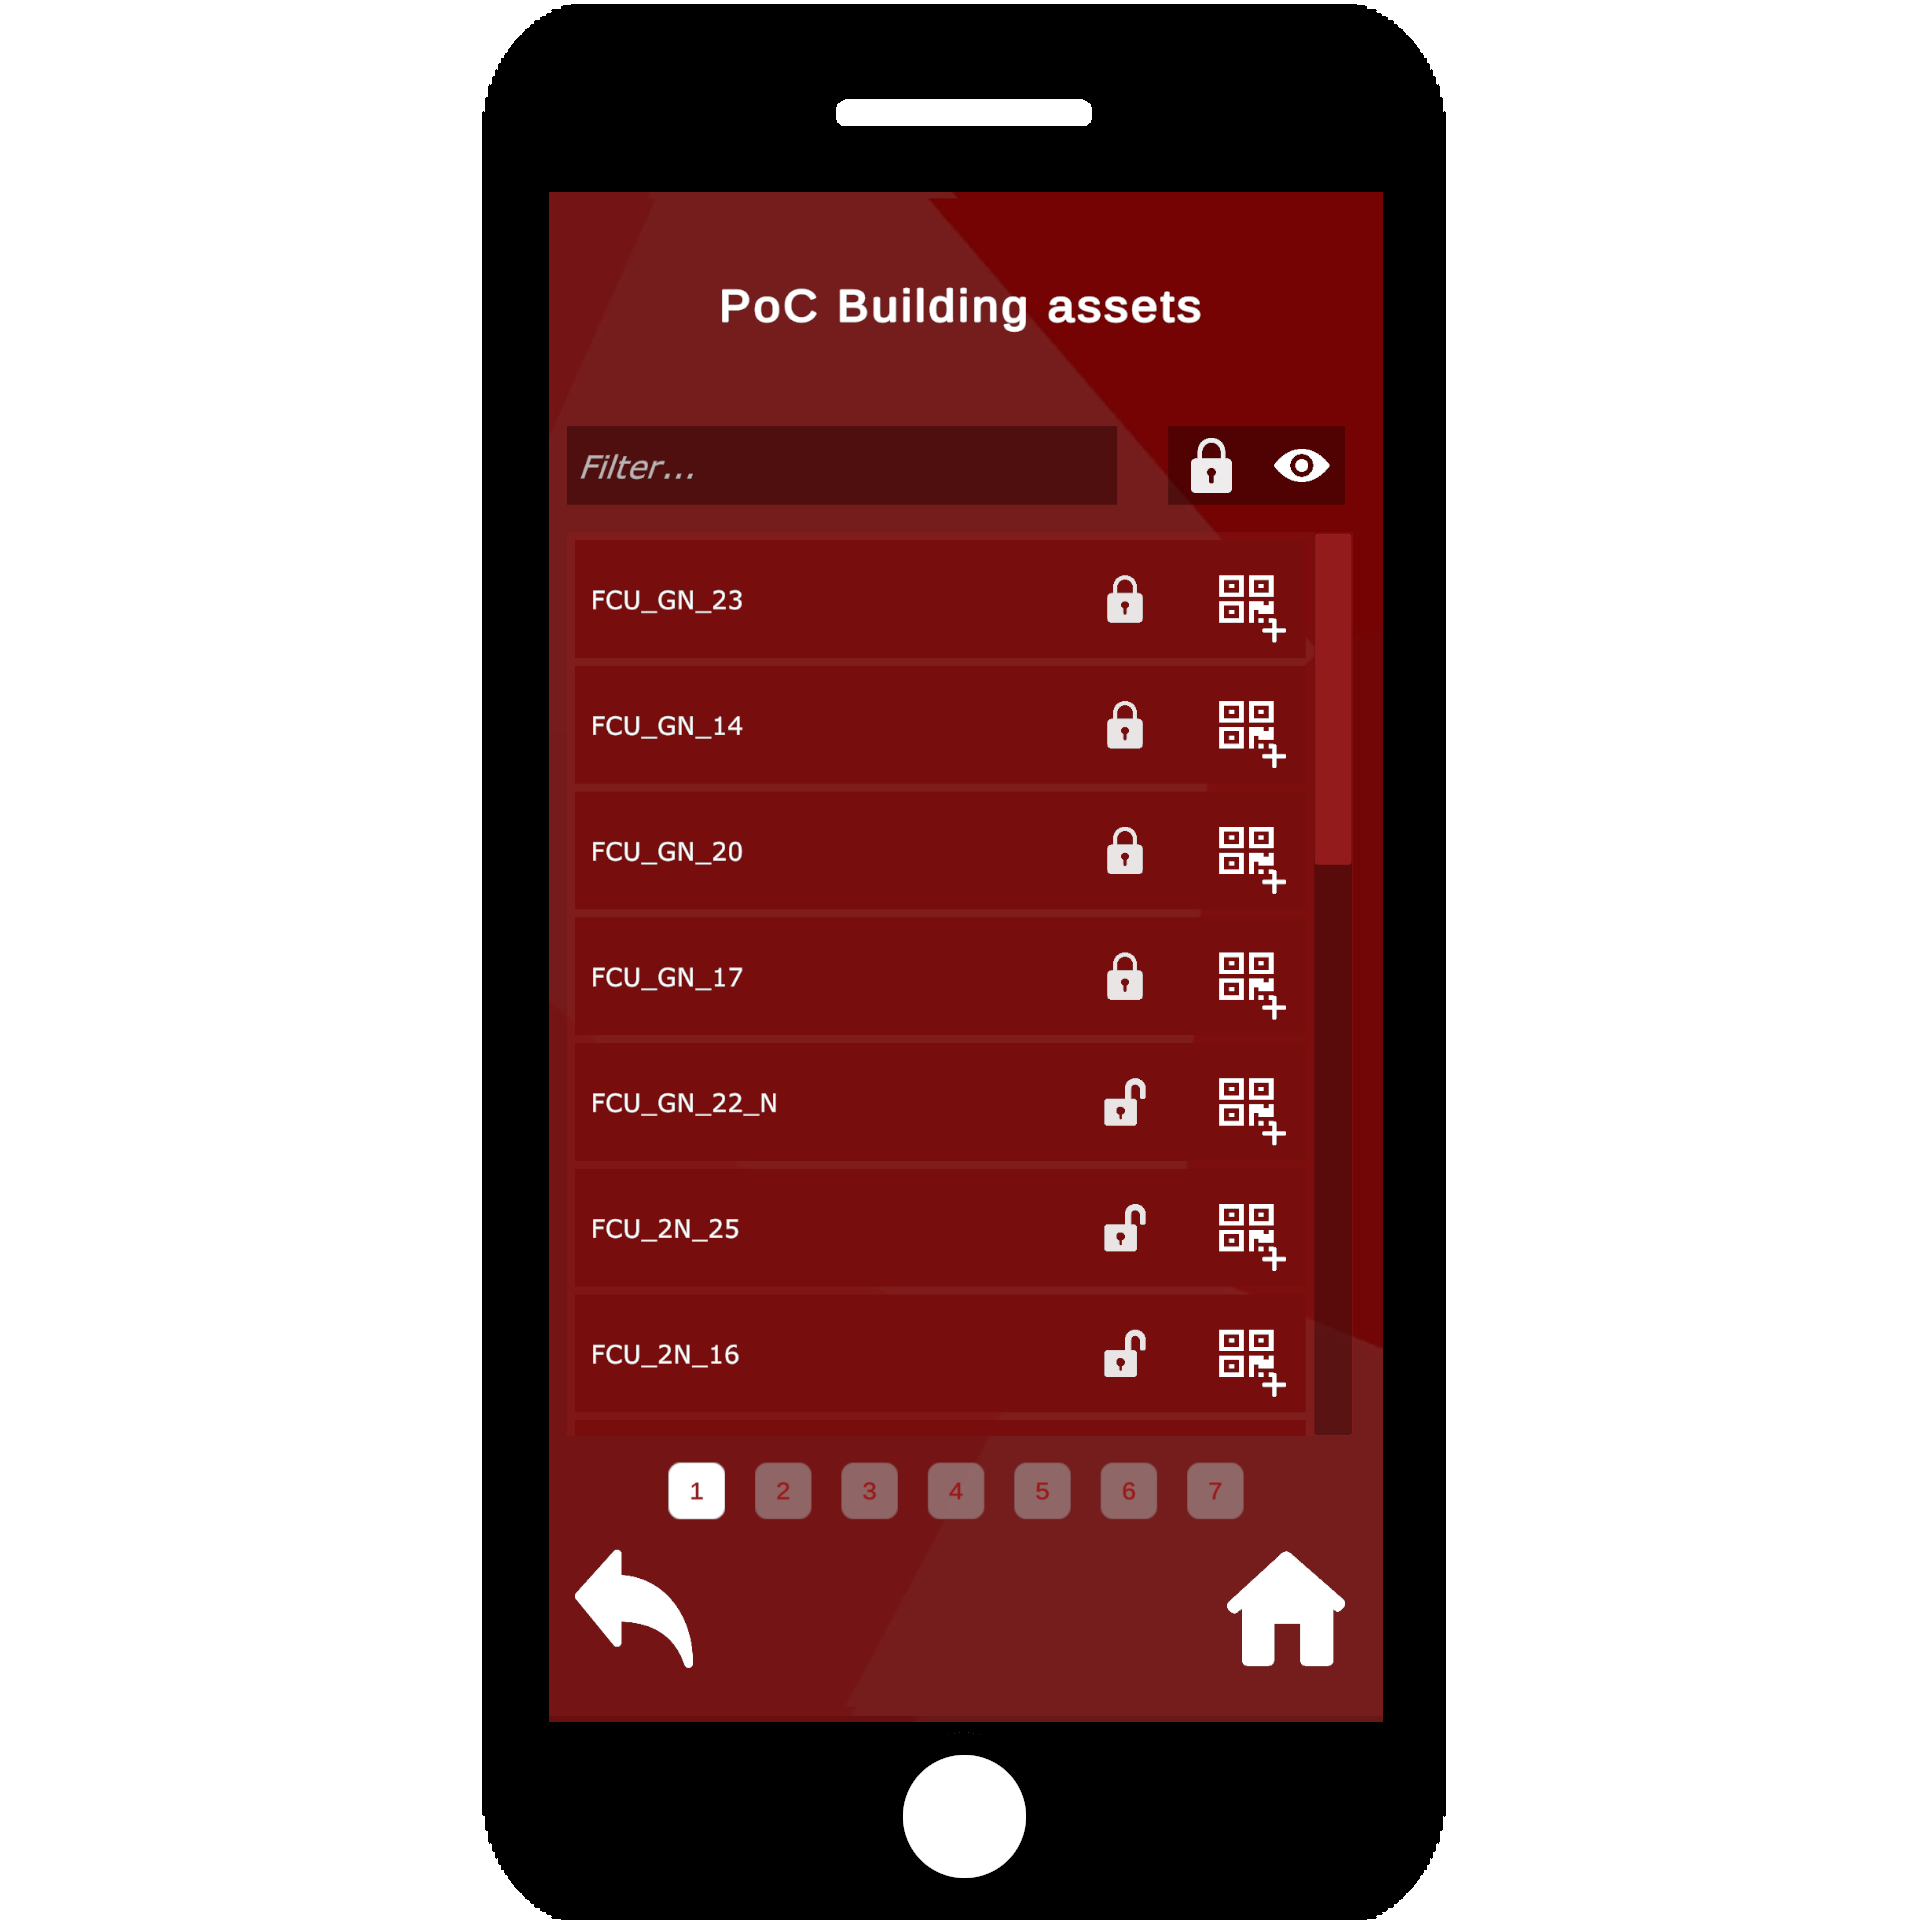
When tagging your assets it is as simple as sticking a preprinted QR or Barcode onto the target asset and then selecting it from the list and reading the QR or Barcode. This takes seconds to do and saves countless wasted hours locating assets over the life of the asset or contract.
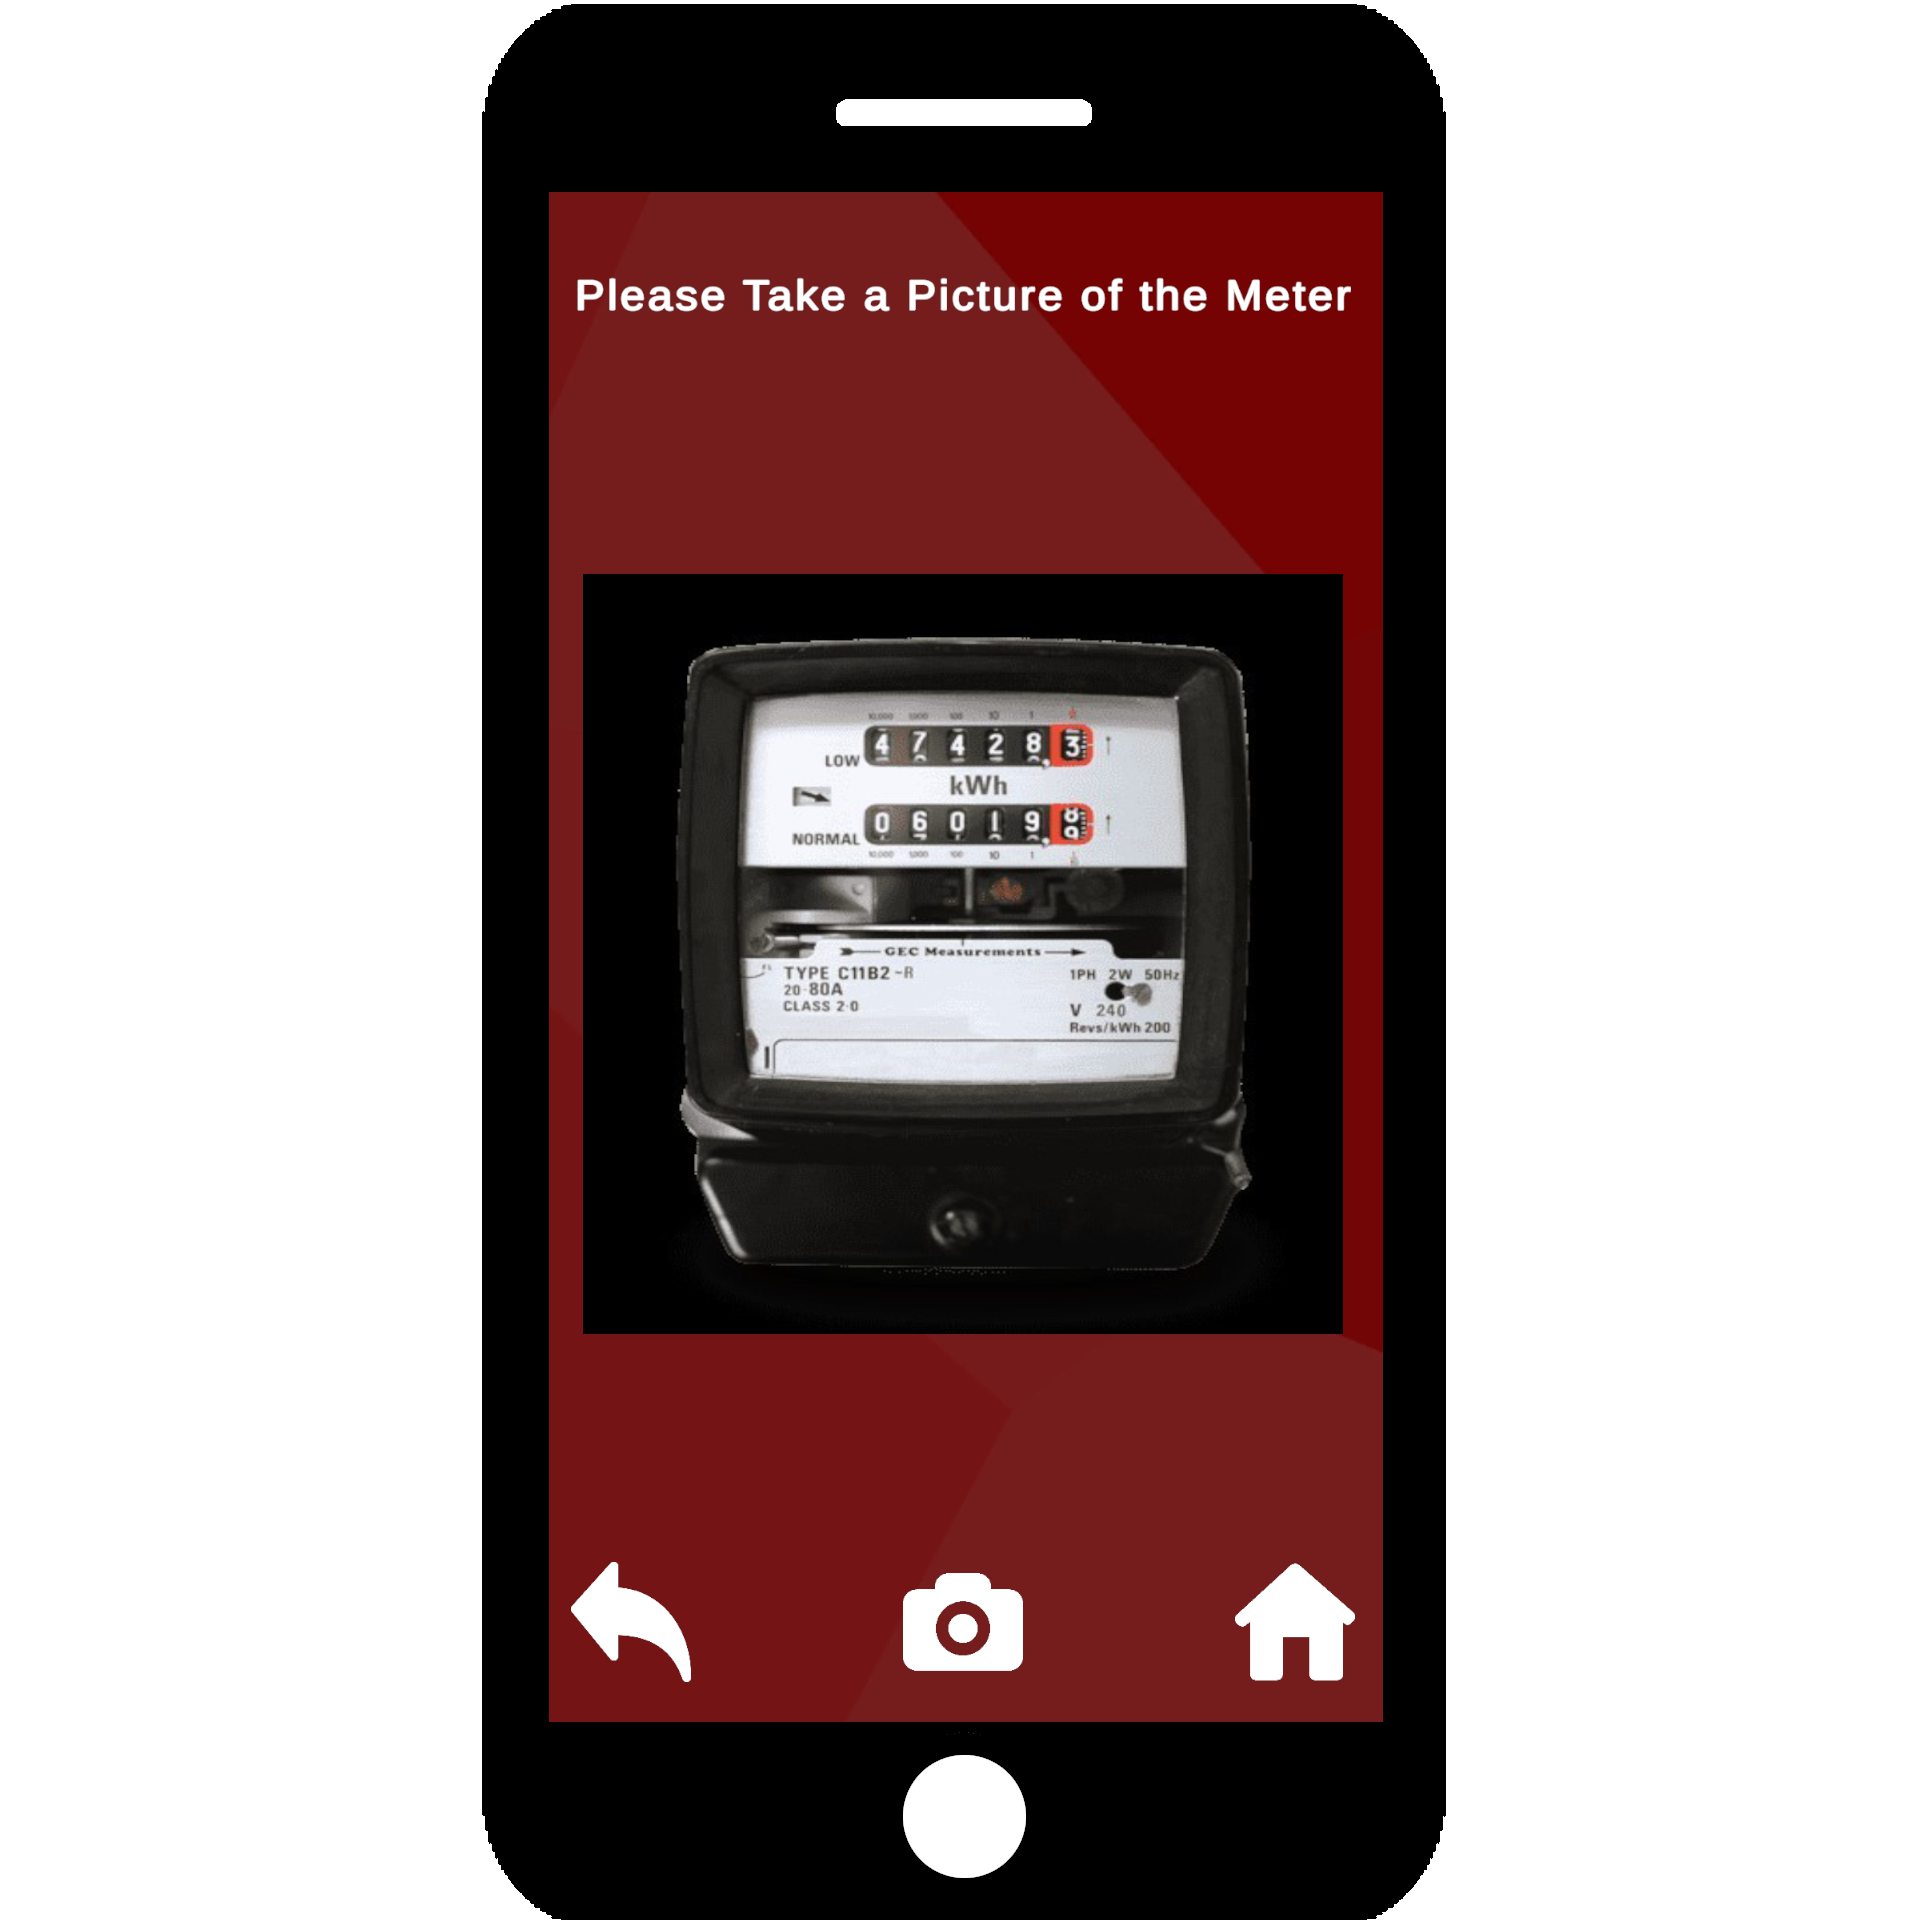
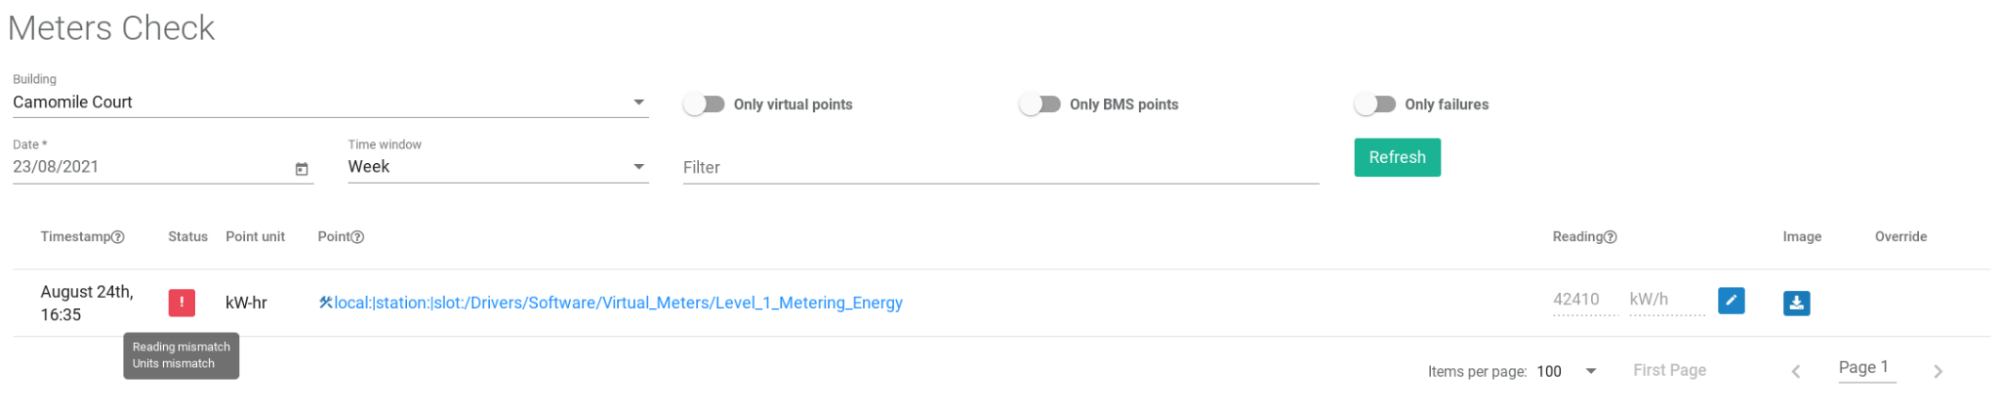
Scanning a meter QR code links the meter with a BMS data point. Once linked you can take a photo of the
meter, input the reading and then send the results to the Digital Building Platform.
The platform will automatically check if the BMS reading is within one standard deviation of the reading
submitted at the given time. You will only be alerted to meters that do not conform however a full audit
trail is kept against the BMS meter point.
When tagging your assets it is as simple as sticking a preprinted QR or Barcode onto the target asset and then selecting it from the list and reading the QR or Barcode. This takes seconds to do and saves countless wasted hours locating assets over the life of the asset or contract.
Selecting a specific fault will provide full details of the submitted fault and allow the user to assign responsibility for the fault to a specific user.
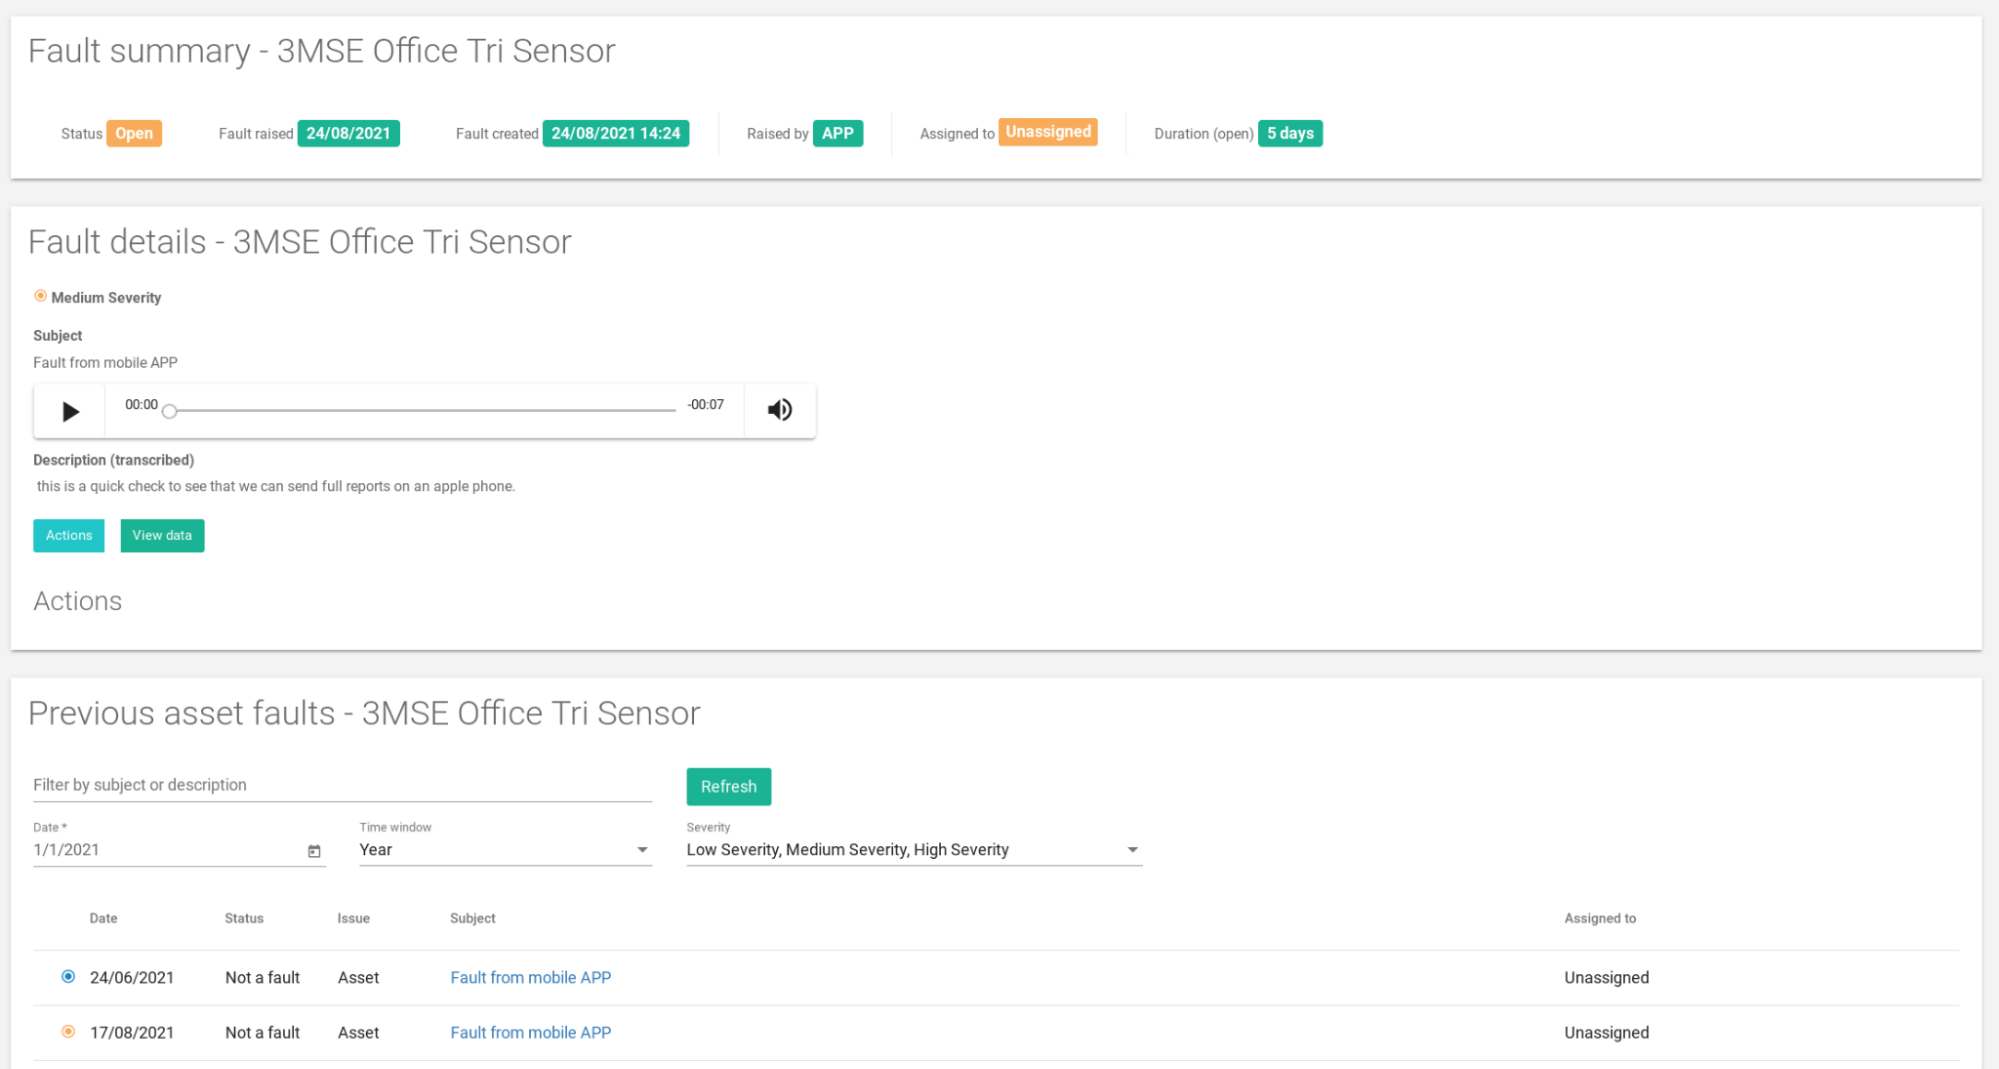
The specifics of the fault data are shown on the faults details page where the fault can be assigned. If the fault was sent in using the audio feature it is automatically transcribed with the audio held for verification. If the fault was assigned to an asset when created; a history of the assets faults will be presented (which may help in diagnosing the current issue). In addition each submitted fault that is assigned to an asset will display a view data button where if selected will present the data from each of the assets data points for at the time the fault was raised.
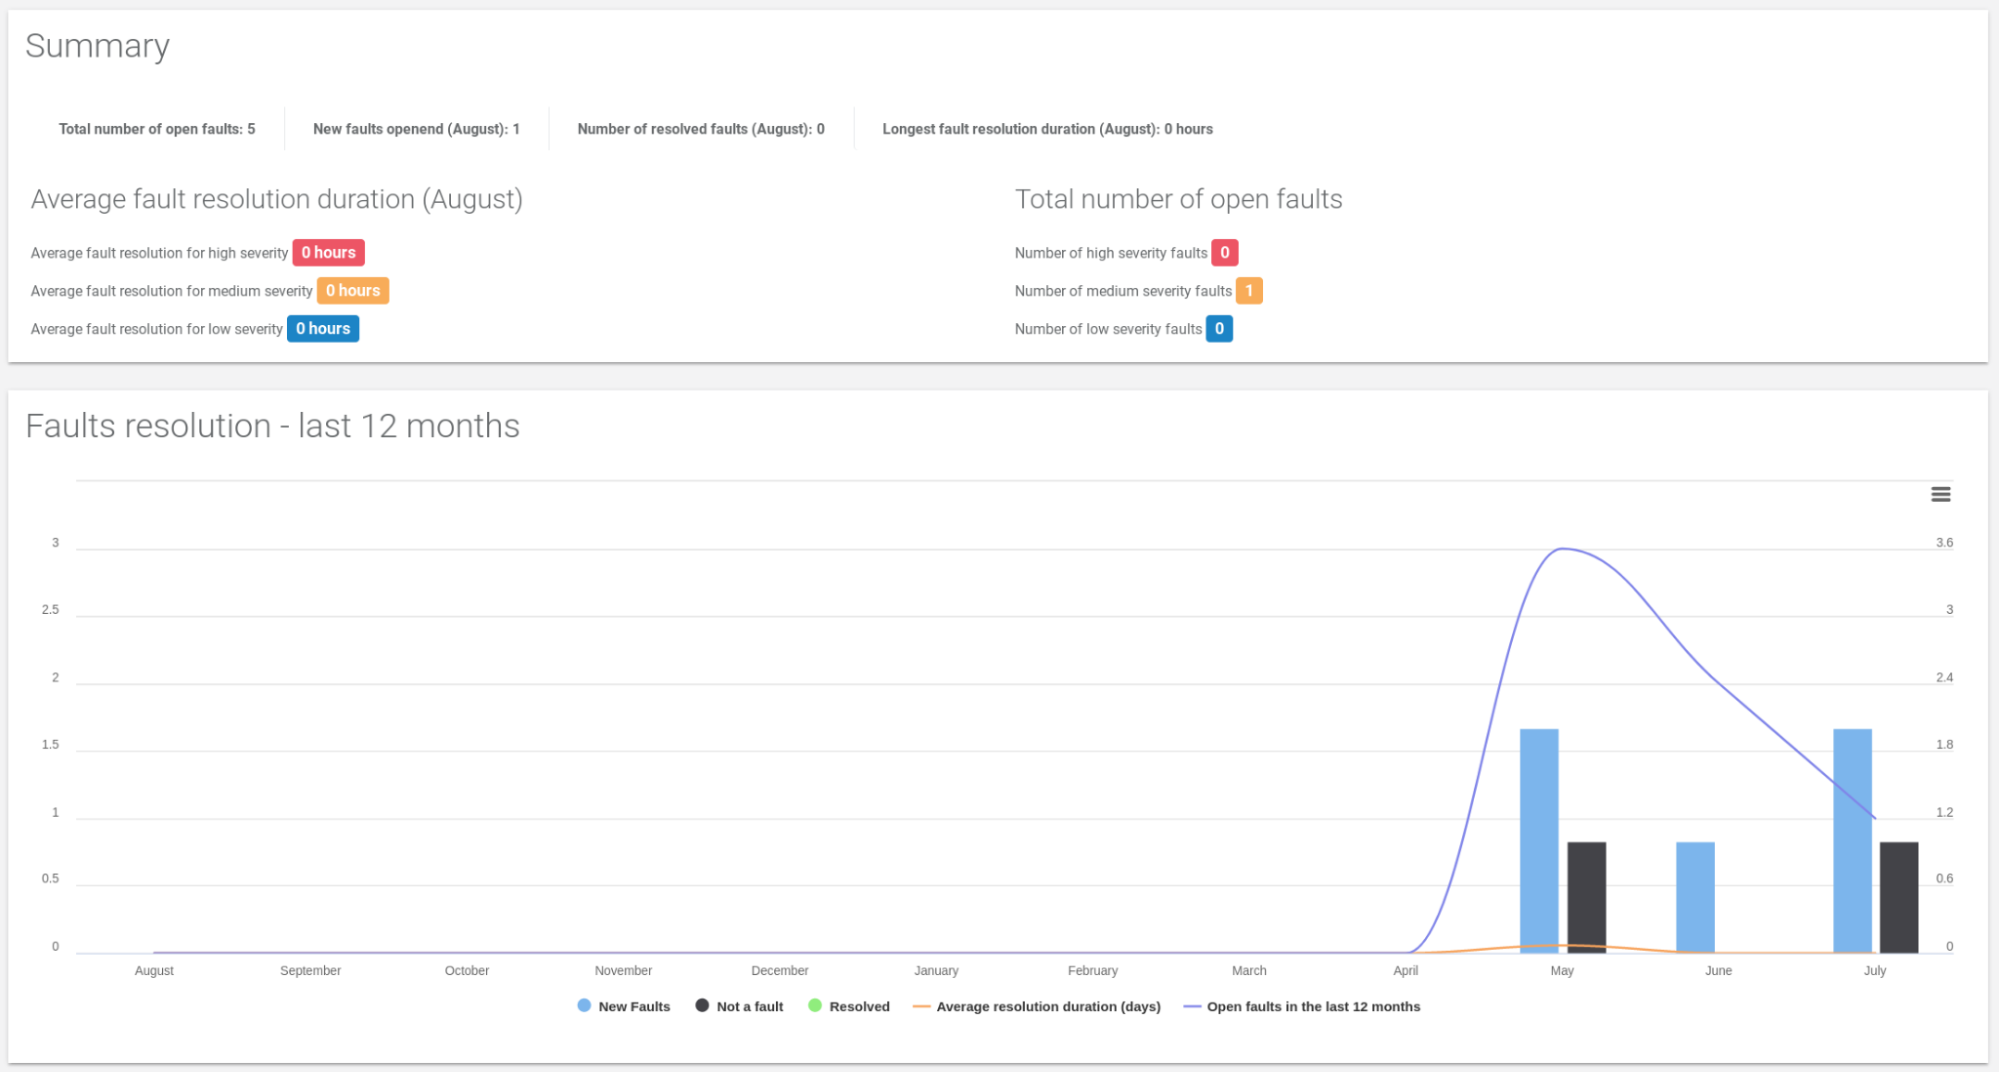
Fault metrics provides you with a graphic analytic view of the fault workflow. The metrics show the number and type of faults as well as trends in each category including duration to resolution. Such analysis will allow you to avoid bottlenecks or downgrades in performance or workload. Fault metrics will empower you to get ahead of any potential issues.
The fault metrics section keeps track of fault types, resolution duration and general performance statistics such as average duration by fault type. One of the key metrics recorded is ‘not a fault’ conditions where an asset has been reported faulty but was either erroneous or the fault responsibility was elsewhere. Knowing how much time is spent on which fault types permits focused workflows saving time and cost.
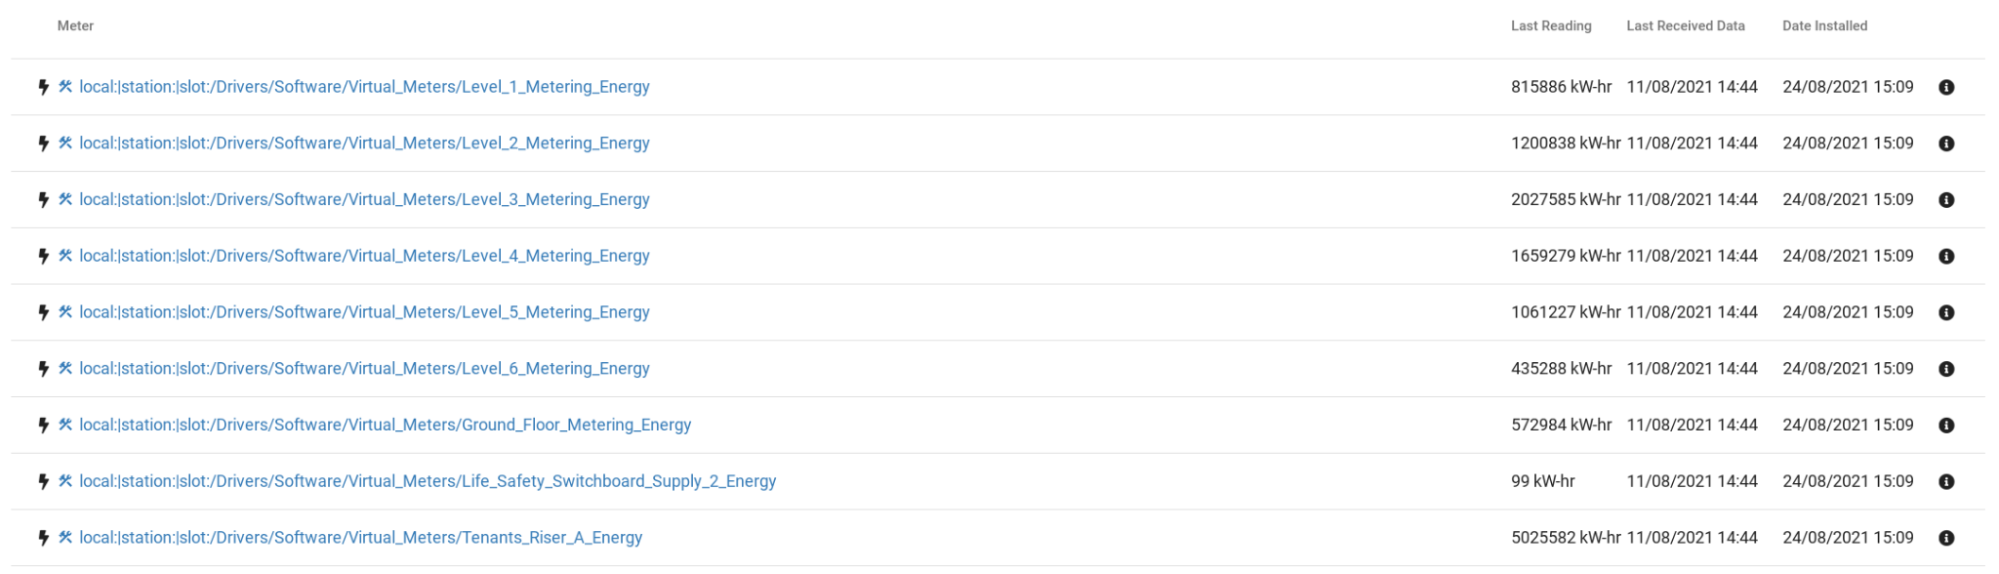
The meter section provides a central point to view and manage all the meters within your building. You can view live meter readings, see calibration data and audit each meter via its log and photos. For meters with linked points into the BMS, the platform will automatically alert you of any points that are out of rain of the physical meter reading. This means you can spend time on the meters that matter rather and let the platform take care of the rest.

An account on the Digital Building Platform is required for the apps to function correctly.
Please contact us for more information.
If you have questions please get in touch via email or phone.
R120, LO24, Reading University
London Road, RG1 5AQ, UK