

WHO (2021) For every 5 µg/m³ increase in PM2.5 levels above 5µg/m³ increases the mortality rate
of the local population by 4%.
WHO PM10 not to exceed 15µg/m³ annually or 45µg/m³ in 24 hours. PM2.5 not to exceed 5µg/m³
annually or 15µg/m³ in 24 hours.
In population studies, nitrogen dioxide has been associated with adverse health effects even
when the annual average nitrogen dioxide concentration complied with the WHO annual guideline
value.
WHO annual guideline value of 10 μg/m3. Daily 25 μg/m3 guideline recommendation. Max 1-hour
concentration exposure 200μg/m3.
Breathing ground-level ozone can result in decrements in lung function, Inflammation of airways,
respiratory symptoms coughing, throat irritation, pain, burning, or discomfort in the chest,
wheezing, or shortness of breath.
The WHO recommended daily maximum exposure of over an 8 hour mean is 100μg/m3 or 60μg/m3 less
than 6 times a year.

When breathed in, sulphur dioxide irritates the nose, throat, and airways causing coughing,
wheezing, shortness of breath; particularly affecting those with asthma.
WHO air quality guideline of exposure of no more than 40 µg/m³ (15 ppb) over a 24h mean.
Symptoms include dizziness, nausea and vomiting, tiredness and confusion with stomach pain and
shortness of breath. Long-term exposure to low levels of carbon monoxide can lead to
neurological symptoms, such as difficulty thinking or concentrating and frequent emotional
changes.
WHO recommends exposure of no more than 4 mg/m³ average over 24 hours. Also 10 mg/m³ over an 8h
mean and 35 mg/m³ over 1h mean and no more than 100 mg/m³ (86 ppm) for a period of 15 minutes.
Harmful to the environment but when in the presence of O3 becomes NO2 which is then harmful to human health. NO has been observed to build up overnight in buildings and is then readily converted to NO2 with the intake of fresh O3 in the morning.
Irritation of the eyes and upper respiratory tract and occupational asthma for longer term exposure. Eye irritation threshold 0.01- 1.9 mg/m.
Effects of VOC: Odour and sensory irritation, mucosal irritation caused by systemic toxicity,
genotoxicity and carcinogenicity.
Benzene is a human carcinogen Group A or 1.
Non carcinogenic effects include speech problems, headaches, dizziness, insomnia, nausea,
fatigue.
Ranges 50-100 ppm for 30 minutes leads to fatigue and headaches. 250-500 ppm causes dizziness,
headaches, faintness and nausea.
When considering IAQ (Indoor Air Quality) it is necessary to view the pollution cycles of the air source outside the building. Outdoor air pollution typically has daily patterns coincident with local sources of pollution generation such as traffic, boilers, generators and cookers.
It is important to note that combustion is predominantly responsible for gaseous pollutants such as NO2 and some particulate matter however with respect to vehicles 70% of the particulate matter that is produced is generated from the brake pads and friction between the tires and the road (and as such is a function of the vehicle's speed & weight). Electric vehicles may reduce some of the local source of NO2; they are typically heavier due to the batteries than their combustion counterparts and thus may well increase the PM problem.
Buildings tend to startup in the morning during rush hour traffic or goods van traffic, inhaling the morning’s peak of pollutants continuing on throughout the day shutting down in the evening at peak rush hour pollution. This results in a building ventilation system taking in and trapping the peaks of pollution at both ends of the day, the worst of all scenarios.
Monitoring internal nighttime pillutants we often see an increase in NO relative to the other pollutants which then reacts with the fresh ozone in the morning.
In the morning the outside air will have higher levels of ozone and when this air is brought into the building it reacts with the now plentiful NO to form NO2, a compound that is harmful to human health.
Filters unless chemically treated will have no effect on gaseous pollutants. Filters can however prove effective against particulate matter if the filter is of sufficient grade.
Natural ventilation while energy efficient typically has no protection against air pollution as such systems tend to not have filters (filters would prevent airflow).
Indoor air quality is a multivariable problem that contains competing factors with a cyclic time component. Such problems are not well suited to traditional BMS systems whose control methodology are typically sense and react. In the case of air quality, there could be the case where the CO2 sensors are asking for higher ventilation however the ozone sensor provides a contrary command.
The solution is multifaceted and ultimately requires a model (Ai) based approach. A model is a mathematical approach that can be used to represent the real world as it is and as it will be, namely the ability to predict future conditions. This allows the system to look into the future and thus can be termed predictive control. By way of example, the system has learned that there is a rise in CO2 in meeting room A at 15:00 on Thursday. The model has learned the rate of change and thus knows how long you have until you reach an action threshold. Historic data suggests this is a weekly meeting and predictable and that it will last only an hour. In this case, you can conclude that while CO2 will rise it will not hit any action threshold and thus the time is better spent managing for other pollutants.
The result is effectively a cost function with non linear targets.
If you are looking for True IAQ solutions backed by the Digital Building Platform and its AQ-Ai Engine then please get in touch.
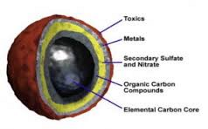
Particulates are commonly understood to be the barely visible particles of matter carried by the air. Particle pollution is made up of a number of components, including acids (such as nitrates and sulphates), organic chemicals, metals, and soil or dust particles. The size of particles is directly linked to their potential for causing health problems. The UK and European regulators are most concerned about particles that are 10 micrometres in diameter (PM10) or smaller as it is those particles that generally pass through the throat and nose and enter the lungs, heart and brain.
| Anually | Daily (24 hours) | |
|---|---|---|
| PM10 < 10 µm WHO | 15 µg/m³ | 45 µg/m³ |
| PM10 < 10 µm EU/UK | 40 µg/m³ | 50 µg/m³ |
| PM2.5 < 2.5 µm WHO | 5 µg/m³ | 15 µg/m³ |
| PM2.5 < 2.5 µm EU/UK | 25 µg/m³ | No legal limit |
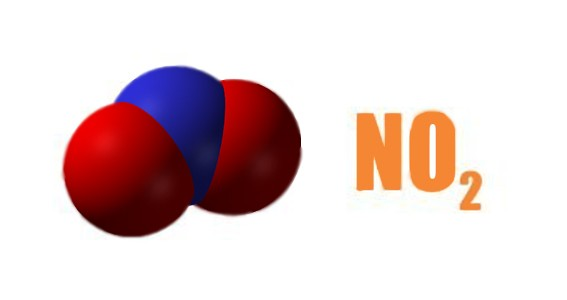
Nitric oxide (NO) and Nitrogen dioxide (NO2) are commonly known as nitrogen oxides or NOx. NOx reacts with ammonia, moisture, and other compounds to form small particles. These small particles penetrate deeply into sensitive parts of the lungs and can cause or worsen respiratory diseases, such as emphysema and bronchitis, and can aggravate existing heart disease, leading to increased hospital admissions and premature death. In addition, ground Ozone is formed when NOx and volatile organic compounds react in the presence of heat and sunlight aggravating health issues. Emissions that lead to the formation of NO2 generally also lead to the formation of NO.
Regs: UK/EU Nitrogen dioxide should not exceed, more than 18 times a year, 200 µg/m³ (105 ppb) NO2 for any hour. It should not exceed 40 µg/m³ (21 ppb) averaged over 1 year. WHO annual guideline value of 10 μg/m3. 24-hour guideline value of 25 µg/m³ and a value of 200µg/m³ for 1-hour nitrogen dioxide concentration.
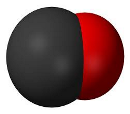
Long-term exposure to low levels of carbon monoxide can lead to neurological symptoms, such as difficulty thinking or concentrating and frequent emotional changes such as being easily irritated, depressed as well as making impulsive or irrational decisions. High levels of exposure can lead to impaired mental state and personality changes (intoxication), vertigo, ataxia, breathlessness and tachycardia, angina or a heart attack, seizures and loss of consciousness and or death.
Regs: EU/UK regulations state that CO should not exceed 10 mg/m³ (8.6 ppm) over an 8-hour mean. World Health Organisation (WHO) has set an air quality guideline of 4mg/m³ for 24-hours also of 10 mg/m³ (8.6 ppm) over an 8h mean. They also specify no more than 35 mg/m³ over 1h mean and no more than 100 mg/m³ (86 ppm) for a period of 15 minutes.
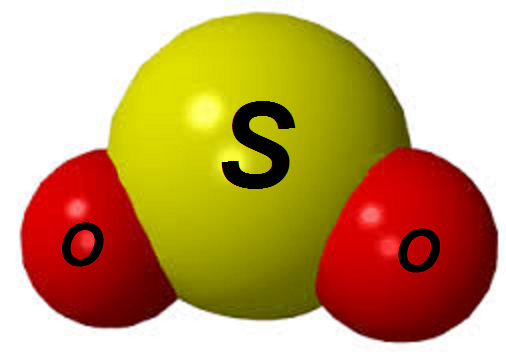
Sulphur Dioxide is an invisible but sharp smelling gas that reacts easily with other substances to form harmful compounds, such as sulphuric acid, sulphurous acid and sulphate particles. 99% of the sulphur dioxide in air comes from human sources the majority of which comes from industrial activity that processes materials that contain sulphur. Sulphur Dioxide when breathed in irritates the nose, throat, and airways causing coughing, wheezing, shortness of breath, or a tight feeling around the chest. The effects of sulphur dioxide are felt very quickly with the worst symptoms occurring 10 or 15 minutes after exposure, particularly affecting those with asthma or similar conditions.
Regs: EU/UK regulations state that SO2 should not exceed 266 µg/m³ (100 ppb) more than 35 times a year over a 15 minute average. Levels should not exceed 350 µg/m³ (131.5 ppb) more than 24 times a year over a 1 hour average and levels of SO2 should not exceed 125 µg/m³ (47 ppb) more than 3 times a year over a 24h mean. The World Health Organisation (WHO) has set an air quality guideline of 40 µg/m³ (15 ppb) over a 24h mean.
Breathing ground-level ozone can result in a number of health effects, those typically observed include Induction of respiratory symptoms, Decrements in lung function, Inflammation of airways. Respiratory symptoms can include coughing, throat irritation, pain, burning, or discomfort in the chest when taking a deep breath, chest tightness, wheezing, or shortness of breath. In addition to the above symptoms, evidence strongly indicates that higher daily ozone concentrations are associated with increased asthma attacks, hospital admissions, daily mortality, and other markers of morbidity. The consistency and coherence of the evidence for effects upon asthmatics suggest that ozone can make asthma symptoms worse and can increase sensitivity to asthma triggers.
Regs: EU/UK regulations state that Ozone (03) should not surpass 100 µg/m³ (50 ppb) more than 10 times a year over an 8h mean. Levels of O3 should not surpass 120 µg/m³ (60 ppb) more than 25 times a year averaged over 3 years.
The World Health Organisation (WHO) has set an air quality guideline of 60 µg/m³ (30 ppb) over an 8-hour mean 6 times a year. Also daily maximum 8-hour Ozone of 100 µg/m³.
If you have questions please get in touch via email or phone.
R120, LO24, Reading University
London Road, RG1 5AQ, UK